正在加载图片...

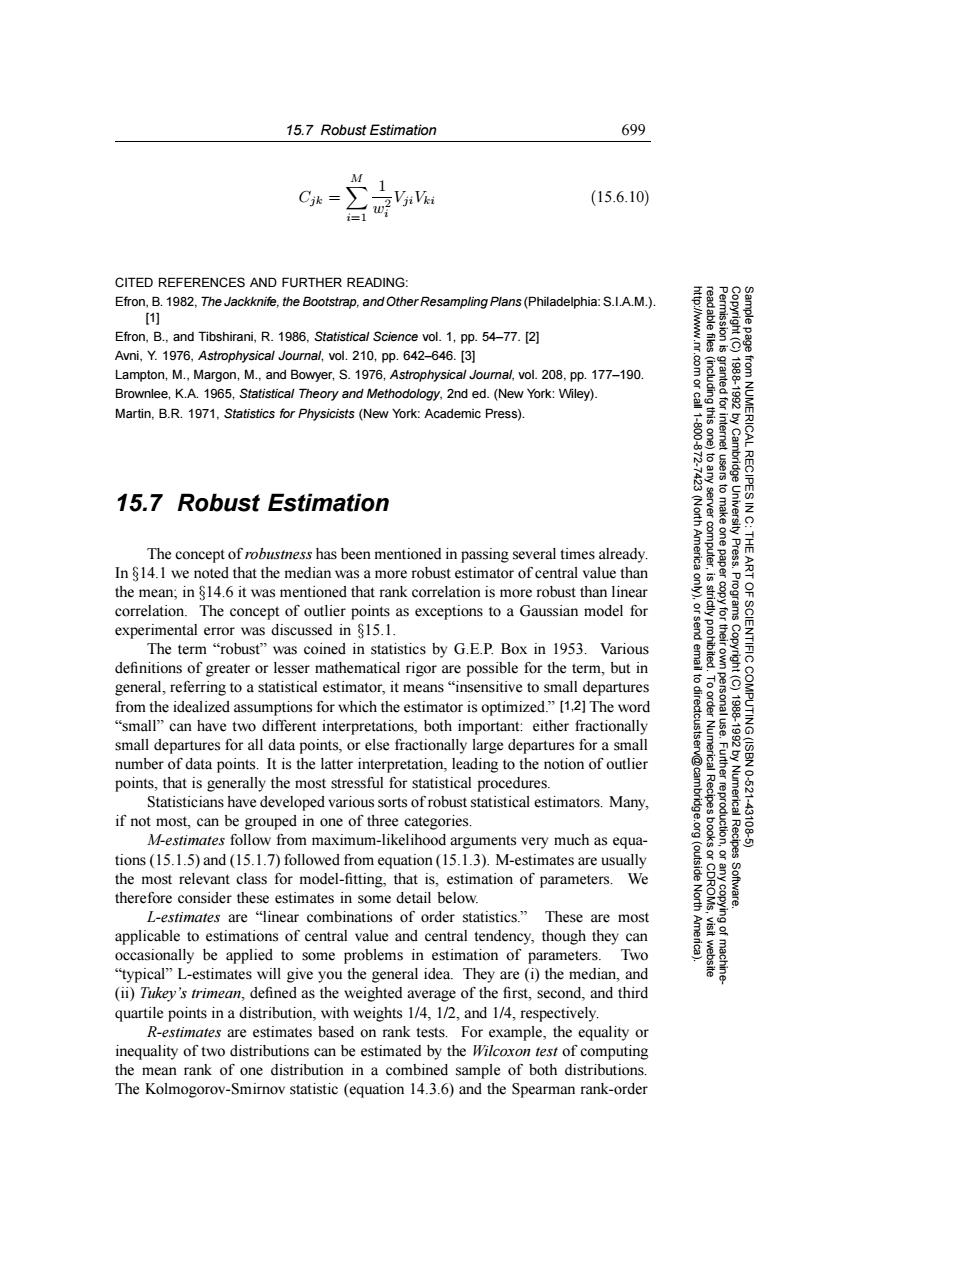
15.7 Robust Estimation 699 M VitVki (15.6.10) CITED REFERENCES AND FURTHER READING: Efron,B.1982,The Jackknife,the Bootstrap,and Other Resampling Plans(Philadelphia:S.I.A.M.). [1] Efron,B..and Tibshirani,R.1986.Statistica/Science vol.1,pp.54-77.[2] Avni,Y.1976,Astrophysical Journal,vol.210,pp.642-646.[3] Lampton,M.,Margon,M.,and Bowyer,S.1976,Astrophysical Journal,vol.208,pp.177-190. Brownlee,K.A.1965,Statistical Theory and Methodology,2nd ed.(New York:Wiley). Martin,B.R.1971,Statistics for Physicists(New York:Academic Press) 15.7 Robust Estimation 、gad的 令 The concept of robustness has been mentioned in passing several times already. Press. In $14.I we noted that the median was a more robust estimator of central value than the mean:in 814.6 it was mentioned that rank correlation is more robust than linear correlation.The concept of outlier points as exceptions to a Gaussian model for experimental error was discussed in 815.1. The term "robust"was coined in statistics by G.E.P.Box in 1953.Various OF SCIENTIFIC definitions of greater or lesser mathematical rigor are possible for the term,but in general,referring to a statistical estimator,it means"insensitive to small departures from the idealized assumptions for which the estimator is optimized."[1,2]The word "small"can have two different interpretations,both important:either fractionally small departures for all data points,or else fractionally large departures for a small number of data points.It is the latter interpretation,leading to the notion of outlier points,that is generally the most stressful for statistical procedures. Numerica 10621 Statisticians have developed various sorts of robust statistical estimators.Many, if not most,can be grouped in one of three categories. 431 M-estimates follow from maximum-likelihood arguments very much as equa- Recipes tions(15.1.5)and (15.1.7)followed from equation(15.1.3).M-estimates are usually the most relevant class for model-fitting,that is,estimation of parameters.We (outside 腿 therefore consider these estimates in some detail below. North L-estimates are "linear combinations of order statistics."These are most applicable to estimations of central value and central tendency,though they can occasionally be applied to some problems in estimation of parameters.Two "typical"L-estimates will give you the general idea.They are(i)the median,and (ii)Tukey's trimean.defined as the weighted average of the first,second,and third quartile points in a distribution,with weights 1/4,1/2,and 1/4,respectively. R-estimates are estimates based on rank tests.For example,the equality or inequality of two distributions can be estimated by the Wilcoxon test of computing the mean rank of one distribution in a combined sample of both distributions. The Kolmogorov-Smirnov statistic (equation 14.3.6)and the Spearman rank-order15.7 Robust Estimation 699 Permission is granted for internet users to make one paper copy for their own personal use. Further reproduction, or any copyin Copyright (C) 1988-1992 by Cambridge University Press. Programs Copyright (C) 1988-1992 by Numerical Recipes Software. Sample page from NUMERICAL RECIPES IN C: THE ART OF SCIENTIFIC COMPUTING (ISBN 0-521-43108-5) g of machinereadable files (including this one) to any server computer, is strictly prohibited. To order Numerical Recipes books or CDROMs, visit website http://www.nr.com or call 1-800-872-7423 (North America only), or send email to directcustserv@cambridge.org (outside North America). Cjk = M i=1 1 w2 i VjiVki (15.6.10) CITED REFERENCES AND FURTHER READING: Efron, B. 1982, The Jackknife, the Bootstrap, and Other Resampling Plans (Philadelphia: S.I.A.M.). [1] Efron, B., and Tibshirani, R. 1986, Statistical Science vol. 1, pp. 54–77. [2] Avni, Y. 1976, Astrophysical Journal, vol. 210, pp. 642–646. [3] Lampton, M., Margon, M., and Bowyer, S. 1976, Astrophysical Journal, vol. 208, pp. 177–190. Brownlee, K.A. 1965, Statistical Theory and Methodology, 2nd ed. (New York: Wiley). Martin, B.R. 1971, Statistics for Physicists (New York: Academic Press). 15.7 Robust Estimation The concept of robustness has been mentioned in passing several times already. In §14.1 we noted that the median was a more robust estimator of central value than the mean; in §14.6 it was mentioned that rank correlation is more robust than linear correlation. The concept of outlier points as exceptions to a Gaussian model for experimental error was discussed in §15.1. The term “robust” was coined in statistics by G.E.P. Box in 1953. Various definitions of greater or lesser mathematical rigor are possible for the term, but in general, referring to a statistical estimator, it means “insensitive to small departures from the idealized assumptions for which the estimator is optimized.” [1,2] The word “small” can have two different interpretations, both important: either fractionally small departures for all data points, or else fractionally large departures for a small number of data points. It is the latter interpretation, leading to the notion of outlier points, that is generally the most stressful for statistical procedures. Statisticians have developed various sorts of robust statistical estimators. Many, if not most, can be grouped in one of three categories. M-estimates follow from maximum-likelihood arguments very much as equations (15.1.5) and (15.1.7) followed from equation (15.1.3). M-estimates are usually the most relevant class for model-fitting, that is, estimation of parameters. We therefore consider these estimates in some detail below. L-estimates are “linear combinations of order statistics.” These are most applicable to estimations of central value and central tendency, though they can occasionally be applied to some problems in estimation of parameters. Two “typical” L-estimates will give you the general idea. They are (i) the median, and (ii) Tukey’s trimean, defined as the weighted average of the first, second, and third quartile points in a distribution, with weights 1/4, 1/2, and 1/4, respectively. R-estimates are estimates based on rank tests. For example, the equality or inequality of two distributions can be estimated by the Wilcoxon test of computing the mean rank of one distribution in a combined sample of both distributions. The Kolmogorov-Smirnov statistic (equation 14.3.6) and the Spearman rank-order