正在加载图片...

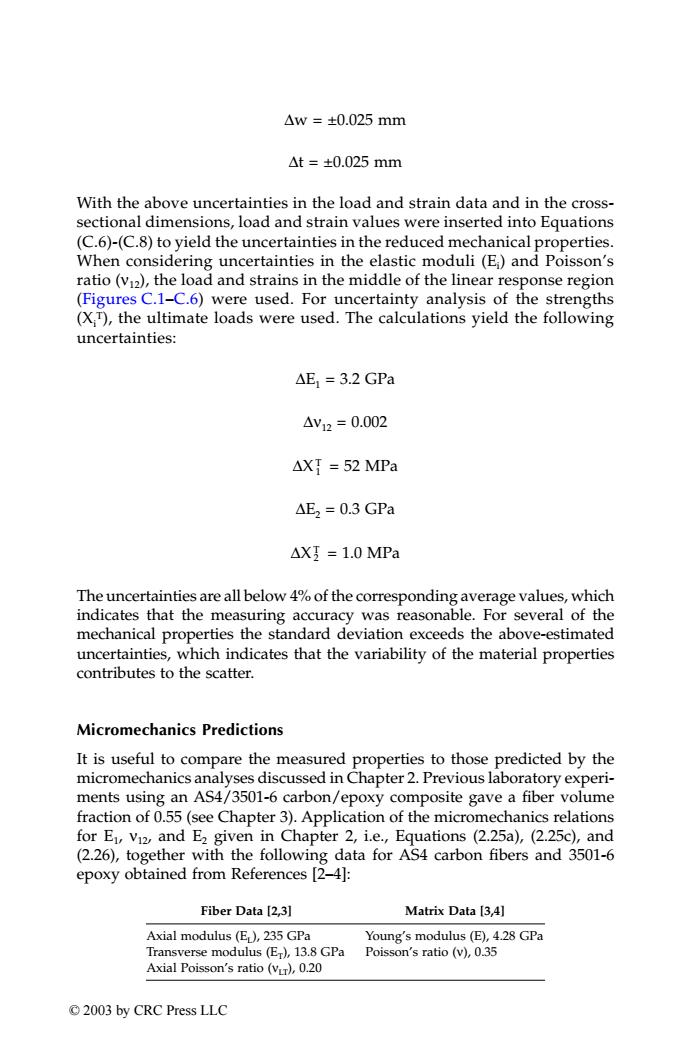
△w=±0.025mm △t=±0.025mm With the above uncertainties in the load and strain data and in the cross- sectional dimensions,load and strain values were inserted into Equations (C.6)-(C.8)to yield the uncertainties in the reduced mechanical properties. When considering uncertainties in the elastic moduli(E)and Poisson's ratio(v12),the load and strains in the middle of the linear response region (Figures C.1-C.6)were used.For uncertainty analysis of the strengths (XT),the ultimate loads were used.The calculations yield the following uncertainties: △E1=3.2GPa △V12=0.002 AXT =52 MPa △E2=0.3GPa △X】=1.0MPa The uncertainties are all below 4%of the corresponding average values,which indicates that the measuring accuracy was reasonable.For several of the mechanical properties the standard deviation exceeds the above-estimated uncertainties,which indicates that the variability of the material properties contributes to the scatter. Micromechanics Predictions It is useful to compare the measured properties to those predicted by the micromechanics analyses discussed in Chapter 2.Previous laboratory experi- ments using an AS4/3501-6 carbon/epoxy composite gave a fiber volume fraction of 0.55(see Chapter 3).Application of the micromechanics relations for E1,Vi2,and E2 given in Chapter 2,i.e.,Equations (2.25a),(2.25c),and (2.26),together with the following data for AS4 carbon fibers and 3501-6 epoxy obtained from References [2-4]: Fiber Data [2,3] Matrix Data [3,4] Axial modulus (EL),235 GPa Young's modulus (E),4.28 GPa Transverse modulus (E),13.8 GPa Poisson's ratio (v),0.35 Axial Poisson's ratio (Vr),0.20 ©2003 by CRC Press LLC∆w = ±0.025 mm ∆t = ±0.025 mm With the above uncertainties in the load and strain data and in the crosssectional dimensions, load and strain values were inserted into Equations (C.6)-(C.8) to yield the uncertainties in the reduced mechanical properties. When considering uncertainties in the elastic moduli (Ei ) and Poisson’s ratio (ν12), the load and strains in the middle of the linear response region (Figures C.1–C.6) were used. For uncertainty analysis of the strengths (Xi T), the ultimate loads were used. The calculations yield the following uncertainties: ∆E1 = 3.2 GPa ∆ν12 = 0.002 ∆X1 T = 52 MPa ∆E2 = 0.3 GPa ∆X2 T = 1.0 MPa The uncertainties are all below 4% of the corresponding average values, which indicates that the measuring accuracy was reasonable. For several of the mechanical properties the standard deviation exceeds the above-estimated uncertainties, which indicates that the variability of the material properties contributes to the scatter. Micromechanics Predictions It is useful to compare the measured properties to those predicted by the micromechanics analyses discussed in Chapter 2. Previous laboratory experiments using an AS4/3501-6 carbon/epoxy composite gave a fiber volume fraction of 0.55 (see Chapter 3). Application of the micromechanics relations for E1, ν12, and E2 given in Chapter 2, i.e., Equations (2.25a), (2.25c), and (2.26), together with the following data for AS4 carbon fibers and 3501-6 epoxy obtained from References [2–4]: Fiber Data [2,3] Matrix Data [3,4] Axial modulus (EL), 235 GPa Transverse modulus (ET), 13.8 GPa Axial Poisson’s ratio (νLT), 0.20 Young’s modulus (E), 4.28 GPa Poisson’s ratio (ν), 0.35 TX001_AppC_Frame Page 233 Saturday, September 21, 2002 5:14 AM © 2003 by CRC Press LLC