正在加载图片...

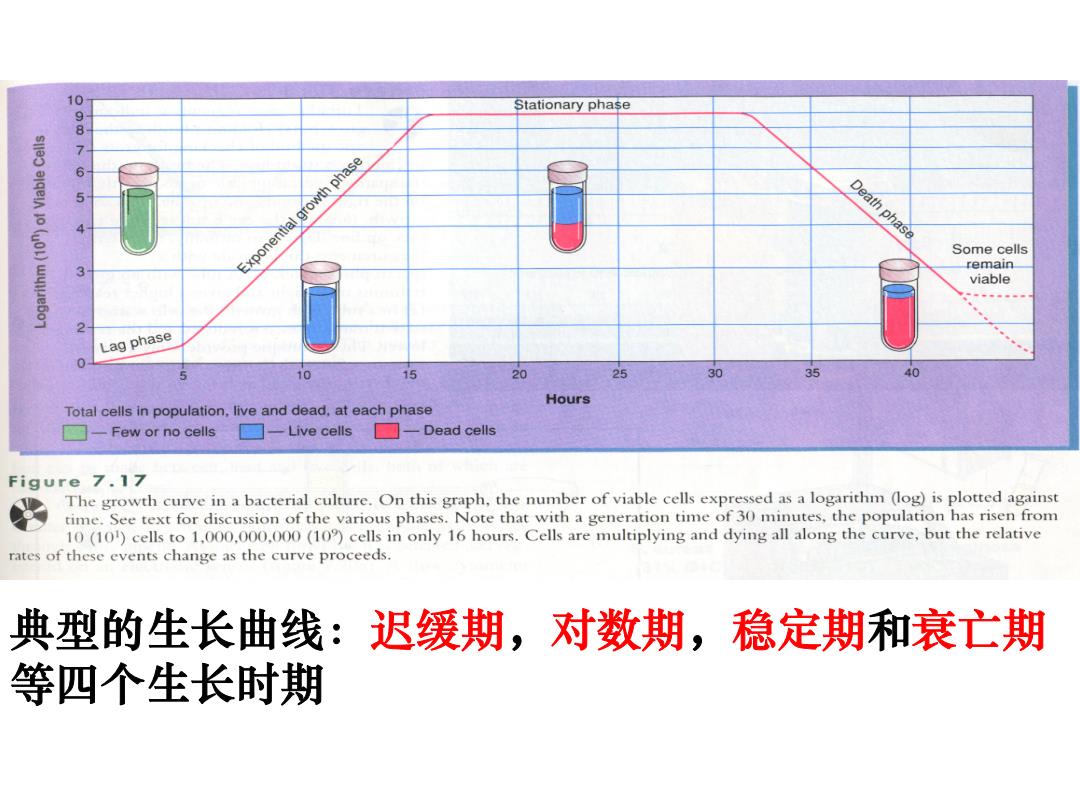
10 Stationary phase 987 6 Exponential growth phase Death phase Some cells remain viable Lag phase 5 10 15 20 25 30 35 40 Hours Total cells in population,live and dead,at each phase 一Few or no cells □Live cells ☐-Dead cells Figure 7.17 The growth curve in a bacterial culture.On this graph,the number of viable cells expressed as a logarithm (log)is plotted against time.See text for discussion of the various phases.Note that with a generation time of 30 minutes,the population has risen from 10(10)cells to 1.000.000.000(10)cells in only 16 hours.Cells are multiplying and dying all along the curve,but the relative rates of these events change as the curve proceeds. 典型的生长曲线:迟缓期,对数期,稳定期和衰亡期 等四个生长时期典型的生长曲线:迟缓期,对数期,稳定期和衰亡期 等四个生长时期