正在加载图片...
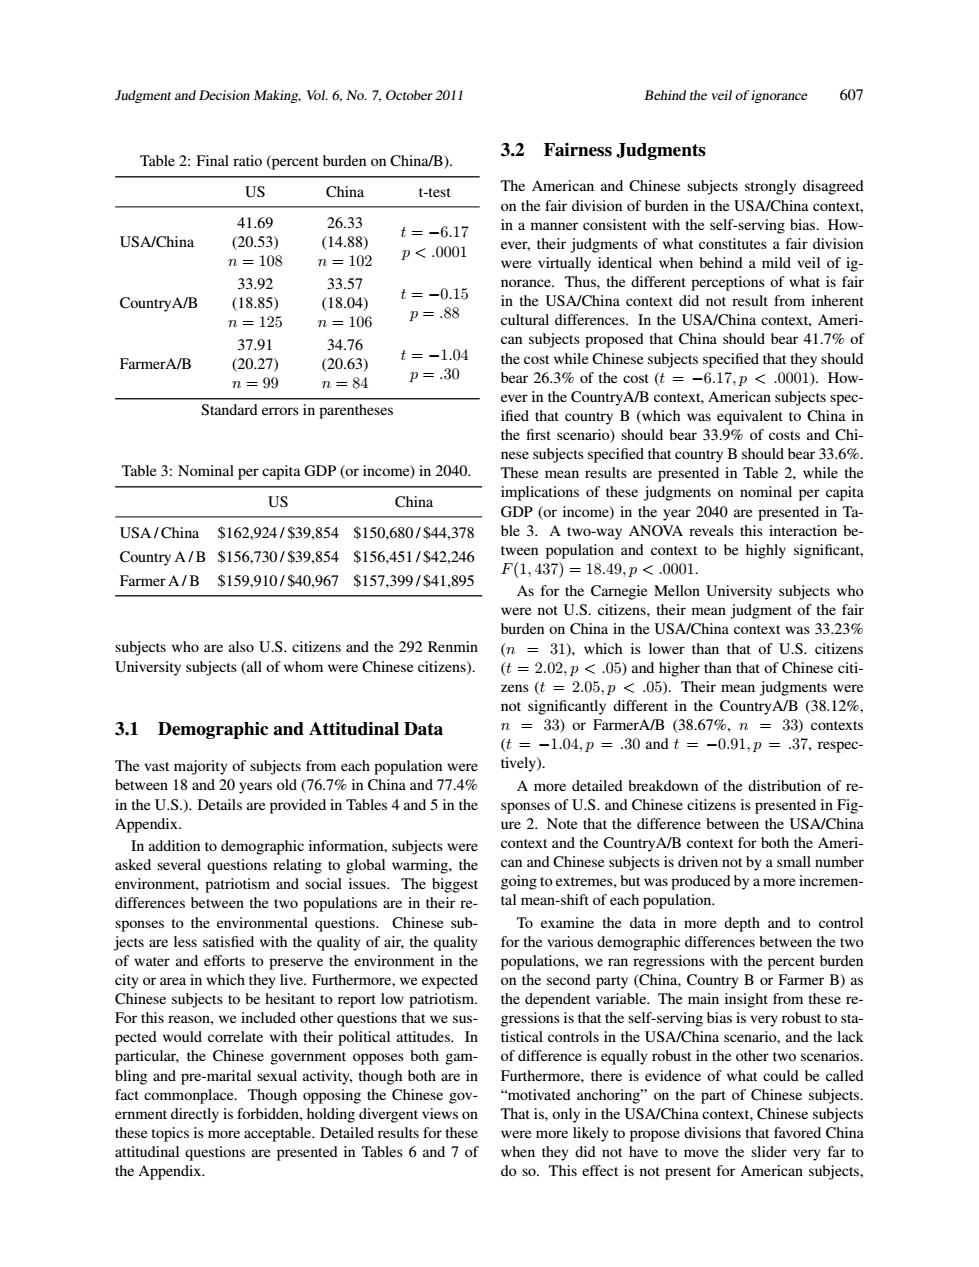
Judgment and Decision Making.Vol.6.No.7.October 2011 Behind the veil of ignorance 607 Table 2:Final ratio (percent burden on China/B). 3.2 Fairness Judgments US China t-test The american and chine 41.69 in a manner consistent with the self-serving bias.How USA/China t= -6.17 p<.0001 r Judgments of fair divisic when 330 3357 the a mild =-015 CountryA/B (18.85 in the usa/china context did not result from inheren n=125 m=106 cultura differences.In the USA/China 3791 34.76 subje China s FarmerA/B (20.63) t=-1.04 (20.27 p=.30 ear 26 36 of the cost (t n=99 =84 ecs6.17, <000.How ever in the CountryA/B context,American subjects spec Standard errors in parentheses that country B ch was equivalent to Chir he nst 336 Table 3:Nominal per capita GDP (or income)in 2040. These mean results are presented in Table 2.while the US mplications of these judgments on nominal pe capita China e)in USA/China$162,924/S39,854 $150.680/S44.378 (on NOVAr 204 are present ulation and co Country A/B$156.730/s39.854$156.451/s42.246 t to be highly significant F(1,437)=18.49.p<.0001 Farmer A/B$159.910/S40.967$157.399/s41.895 As for the Carnegie Mellon University subjects who were not U.S citize mean judgment of den o Uny t =2 0205)and higher than that of chinese citi ens (t 2.05.D<.05) Their mean judgments were he (38.12 3.1 Demographic and Attitudinal Data =-104=30 andt= -0.91,p=37,e each lation wer tivelv). A more detailed breakdown of the distribution of re. in the U.S.).Details are provided in Tables 4 and 5 in the sented in Fig hat the diffe n addition to de ographic informtion,subjects were can and Chinese subiects is driven not by a small number differences between the two populations are in their re sponses to the environmental questions Chinese sub To examine the data in more depth and to control s are le th the c y of air,the e vanous de s between the or area in which they live.Furthermore.we on the second party (China.Country Bor Farmer Bas Chinese subjects to be hesitant to report low patriotism. the dependent va riable.The main insight from these re- s re n,we uded er q that we s litie ssions is t rving bias is very robu hoth ga st in the bling and pre-marital ugh both are in Furthermore there is evidence of what could be called fact commonplace. Though opposing the Chines motivated anchoring"on the part of Chinese subjects t vie nese ttitudinal a ions are resented in Tables 6 and 7 of when they did not have to move the slider very far to the Appendix. do so.This effect is not present for American subjects.Judgment and Decision Making, Vol. 6, No. 7, October 2011 Behind the veil of ignorance 607 Table 2: Final ratio (percent burden on China/B). US China t-test USA/China 41.69 (20.53) n = 108 26.33 (14.88) n = 102 t = −6.17 p < .0001 CountryA/B 33.92 (18.85) n = 125 33.57 (18.04) n = 106 t = −0.15 p = .88 FarmerA/B 37.91 (20.27) n = 99 34.76 (20.63) n = 84 t = −1.04 p = .30 Standard errors in parentheses Table 3: Nominal per capita GDP (or income) in 2040. US China USA / China $162,924 / $39,854 $150,680 / $44,378 Country A / B $156,730 / $39,854 $156,451 / $42,246 Farmer A / B $159,910 / $40,967 $157,399 / $41,895 subjects who are also U.S. citizens and the 292 Renmin University subjects (all of whom were Chinese citizens). 3.1 Demographic and Attitudinal Data The vast majority of subjects from each population were between 18 and 20 years old (76.7% in China and 77.4% in the U.S.). Details are provided in Tables 4 and 5 in the Appendix. In addition to demographic information, subjects were asked several questions relating to global warming, the environment, patriotism and social issues. The biggest differences between the two populations are in their responses to the environmental questions. Chinese subjects are less satisfied with the quality of air, the quality of water and efforts to preserve the environment in the city or area in which they live. Furthermore, we expected Chinese subjects to be hesitant to report low patriotism. For this reason, we included other questions that we suspected would correlate with their political attitudes. In particular, the Chinese government opposes both gambling and pre-marital sexual activity, though both are in fact commonplace. Though opposing the Chinese government directly is forbidden, holding divergent views on these topics is more acceptable. Detailed results for these attitudinal questions are presented in Tables 6 and 7 of the Appendix. 3.2 Fairness Judgments The American and Chinese subjects strongly disagreed on the fair division of burden in the USA/China context, in a manner consistent with the self-serving bias. However, their judgments of what constitutes a fair division were virtually identical when behind a mild veil of ignorance. Thus, the different perceptions of what is fair in the USA/China context did not result from inherent cultural differences. In the USA/China context, American subjects proposed that China should bear 41.7% of the cost while Chinese subjects specified that they should bear 26.3% of the cost (t = −6.17, p < .0001). However in the CountryA/B context, American subjects specified that country B (which was equivalent to China in the first scenario) should bear 33.9% of costs and Chinese subjects specified that country B should bear 33.6%. These mean results are presented in Table 2, while the implications of these judgments on nominal per capita GDP (or income) in the year 2040 are presented in Table 3. A two-way ANOVA reveals this interaction between population and context to be highly significant, F(1, 437) = 18.49, p < .0001. As for the Carnegie Mellon University subjects who were not U.S. citizens, their mean judgment of the fair burden on China in the USA/China context was 33.23% (n = 31), which is lower than that of U.S. citizens (t = 2.02, p < .05) and higher than that of Chinese citizens (t = 2.05, p < .05). Their mean judgments were not significantly different in the CountryA/B (38.12%, n = 33) or FarmerA/B (38.67%, n = 33) contexts (t = −1.04, p = .30 and t = −0.91, p = .37, respectively). A more detailed breakdown of the distribution of responses of U.S. and Chinese citizens is presented in Figure 2. Note that the difference between the USA/China context and the CountryA/B context for both the American and Chinese subjects is driven not by a small number going to extremes, but was produced by a more incremental mean-shift of each population. To examine the data in more depth and to control for the various demographic differences between the two populations, we ran regressions with the percent burden on the second party (China, Country B or Farmer B) as the dependent variable. The main insight from these regressions is that the self-serving bias is very robust to statistical controls in the USA/China scenario, and the lack of difference is equally robust in the other two scenarios. Furthermore, there is evidence of what could be called “motivated anchoring” on the part of Chinese subjects. That is, only in the USA/China context, Chinese subjects were more likely to propose divisions that favored China when they did not have to move the slider very far to do so. This effect is not present for American subjects