正在加载图片...
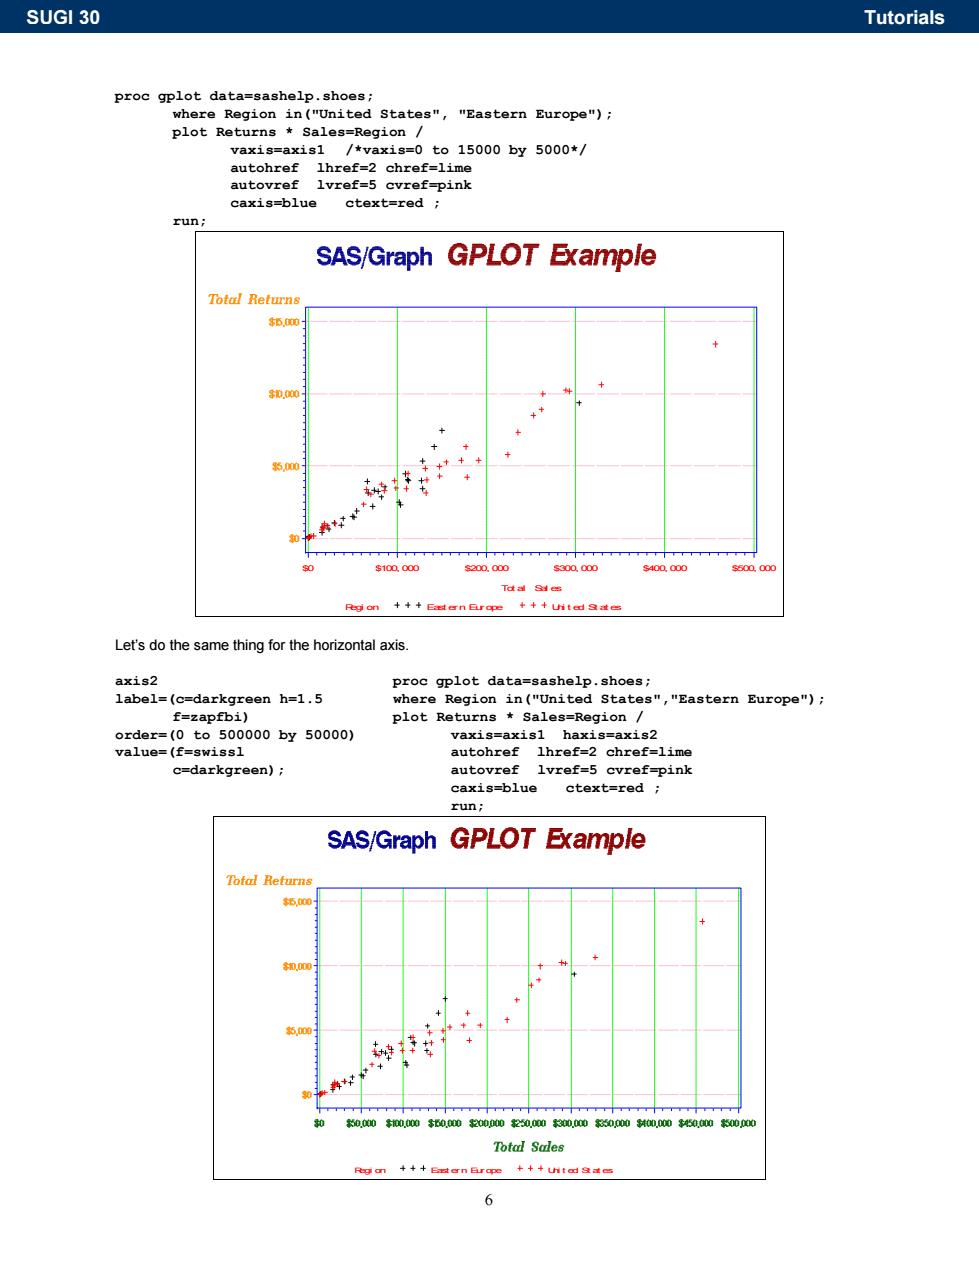
SUGI 30 Tutorials proc gplot data=sashelp.shoes; where Region in("United States","Eastern Europe"); plot Returns Sales=Region vaxis=axis1 /*vaxis=0 to 15000 by 5000*/ autohref lhref=2 chref=lime autovref lvref=5 cvref-pink caxis=blue ctext=red run; SAS/Graph GPLOT Example Total Returns $5.00 3D.000 600 $100000 s200.000 s300.000 $400000 500000 Taal Sies Reg on ++Eaen Erope+++uited gae Let's do the same thing for the horizontal axis. axis2 proc gplot data=sashelp.shoes; label=(c=darkgreen h=1.5 where Region in("United States","Eastern Europe"); f=zapfbi)】 plot Returns Sales=Region order=(0to500000by50000) vaxis=axisl haxis=axis2 value=(f=swissl autohref lhref=2 chref=lime c=darkgreen); autovref lvref=5 cvref=pink caxis=blue ctext=red run; SAS/Graph GPLOT Example Total Returns 5000 4 6000 0.0$000帕0.0020000250030.0500000050000 Total Sales 66 proc gplot data=sashelp.shoes; where Region in("United States", "Eastern Europe"); plot Returns * Sales=Region / vaxis=axis1 /*vaxis=0 to 15000 by 5000*/ autohref lhref=2 chref=lime autovref lvref=5 cvref=pink caxis=blue ctext=red ; run; Regi on East ern Europe Uni t ed St at es Tot al Sal es $0 $100, 000 $200, 000 $300, 000 $400, 000 $500, 000 Let’s do the same thing for the horizontal axis. axis2 label=(c=darkgreen h=1.5 f=zapfbi) order=(0 to 500000 by 50000) value=(f=swissl c=darkgreen); proc gplot data=sashelp.shoes; where Region in("United States","Eastern Europe"); plot Returns * Sales=Region / vaxis=axis1 haxis=axis2 autohref lhref=2 chref=lime autovref lvref=5 cvref=pink caxis=blue ctext=red ; run; Regi on East ern Europe Uni t ed St at es SUGI 30 Tutorials