正在加载图片...

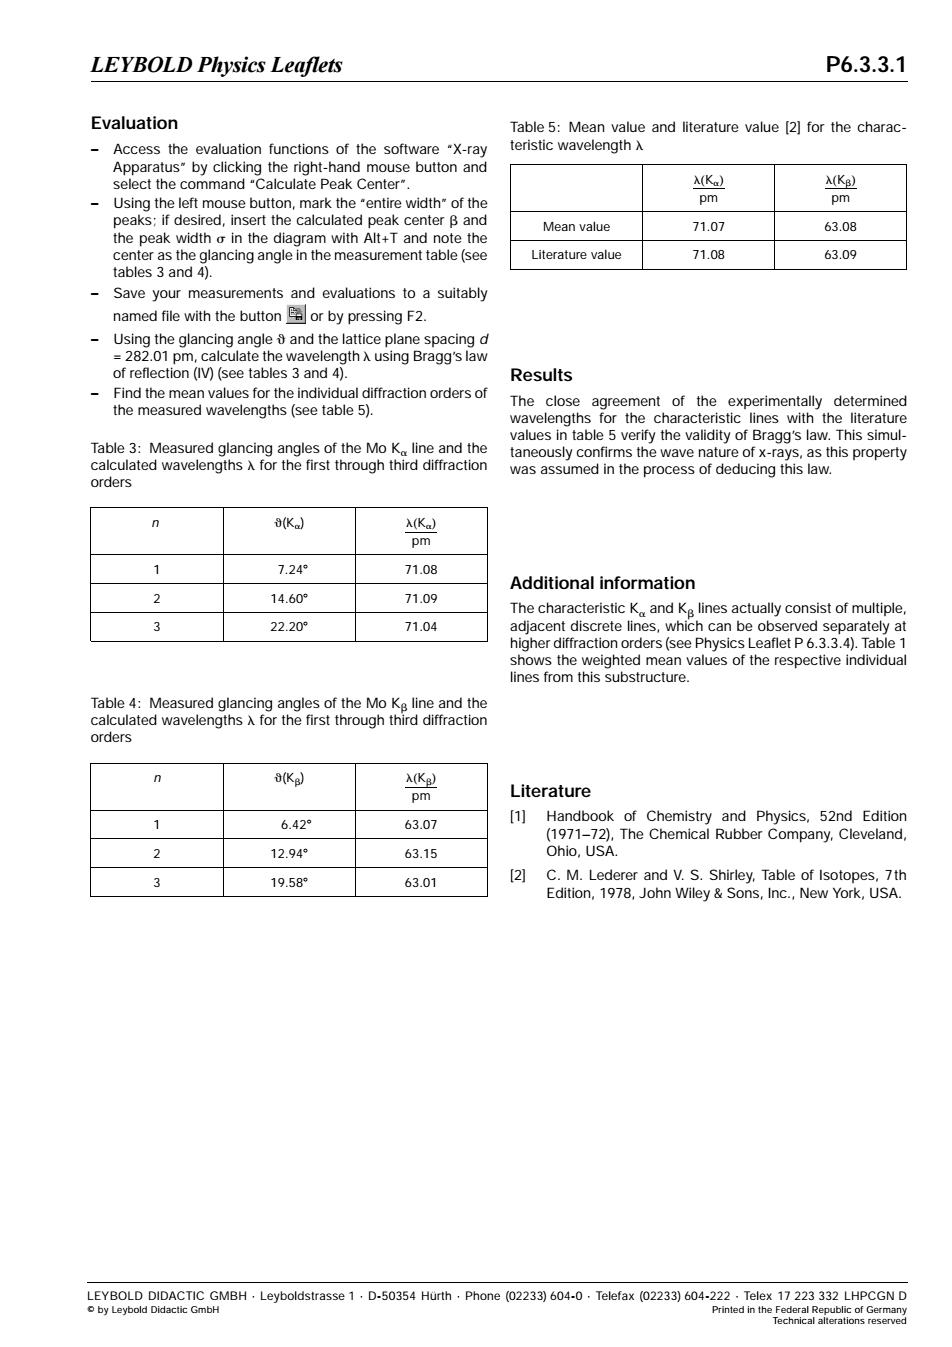
LEYBOLD Physics Leaflets P6.3.3.1 Evaluation Table 5:Mean value and literature value [2]for the charac- Access the evaluation functions of the software "X-ray teristic wavelengthλ Apparatus"by clicking the right-hand mouse button and select the command"Calculate Peak Center" A(Ka) X(Kg) Using the left mouse button,mark the "entire width"of the pm pm peaks;if desired,insert the calculated peak center B and Mean value 71.07 63.08 the peak width o in the diagram with Alt+T and note the center as the glancing angle in the measurement table (see Literature value 71.08 63.09 tables 3 and 4). Save your measurements and evaluations to a suitably named file with the buttonor by pressing F2. Using the glancing angle and the lattice plane spacing d =282.01 pm,calculate the wavelength A using Bragg's law of reflection(IV)(see tables 3 and 4). Results Find the mean values for the individual diffraction orders of The close agreement of the experimentally determined the measured wavelengths (see table 5). wavelengths for the characteristic lines with the literature values in table 5 verify the validity of Bragg's law.This simul- Table 3:Measured glancing angles of the Mo K line and the taneously confirms the wave nature of x-rays,as this property calculated wavelengths A for the first through third diffraction was assumed in the process of deducing this law. orders (K.) A(Ka) pm 1 7.24° 71.08 Additional information 2 14.60° 71.09 The characteristic K and Ke lines actually consist of multiple 3 22.20° 71.04 adjacent discrete lines,which can be observed separately at higher diffraction orders(see Physics Leaflet P 6.3.3.4).Table 1 shows the weighted mean values of the respective individual lines from this substructure. Table 4:Measured glancing angles of the Mo Ke line and the calculated wavelengths A for the first through third diffraction orders n a(Kp) X(Kg) pm Literature 6.42° [1]Handbook of Chemistry and Physics,52nd Edition 63.07 (1971-72),The Chemical Rubber Company,Cleveland, 3 12.94° 63.15 Ohio,USA. 19.58° 63.01 [2 C.M.Lederer and V.S.Shirley,Table of Isotopes,7th Edition,1978,John Wiley Sons,Inc.,New York,USA. LEYBOLD DIDACTIC GMBH.Leyboldstrasse 1.D-50354 Hurth.Phone(02233)604-0.Telefax(02233)604-222.Telex 17 223 332 LHPCGN D by Leybold Didactic GmbH PHiniednthefeieeRsReaaeame☒Evaluation – Access the evaluation functions of the software “X-ray Apparatus” by clicking the right-hand mouse button and select the command “Calculate Peak Center”. – Using the left mouse button, mark the “entire width” of the peaks; if desired, insert the calculated peak center b and the peak width s in the diagram with Alt+T and note the center as the glancing angle in the measurement table (see tables 3 and 4). – Save your measurements and evaluations to a suitably named file with the button or by pressing F2. – Using the glancing angle q and the lattice plane spacing d = 282.01 pm, calculate the wavelength l using Bragg’s law of reflection (IV) (see tables 3 and 4). – Find the mean values for the individual diffraction orders of the measured wavelengths (see table 5). Results The close agreement of the experimentally determined wavelengths for the characteristic lines with the literature values in table 5 verify the validity of Bragg’s law. This simultaneously confirms the wave nature of x-rays, as this property was assumed in the process of deducing this law. Additional information The characteristic Ka and Kb lines actually consist of multiple, adjacent discrete lines, which can be observed separately at higher diffraction orders (see Physics Leaflet P 6.3.3.4). Table 1 shows the weighted mean values of the respective individual lines from this substructure. Literature [1] Handbook of Chemistry and Physics, 52nd Edition (1971−72), The Chemical Rubber Company, Cleveland, Ohio, USA. [2] C. M. Lederer and V. S. Shirley, Table of Isotopes, 7th Edition, 1978, John Wiley & Sons, Inc., New York, USA. n q(Ka) l(Ka) pm 1 7.248 71.08 2 14.608 71.09 3 22.208 71.04 Table 3: Measured glancing angles of the Mo Ka line and the calculated wavelengths l for the first through third diffraction orders n q(Kb) l(Kb) pm 1 6.428 63.07 2 12.948 63.15 3 19.588 63.01 Table 4: Measured glancing angles of the Mo Kb line and the calculated wavelengths l for the first through third diffraction orders l(Ka) pm l(Kb) pm Mean value 71.07 63.08 Literature value 71.08 63.09 Table 5: Mean value and literature value [2] for the characteristic wavelength l LEYBOLD DIDACTIC GMBH ⋅ Leyboldstrasse 1 ⋅ D-50354 Hürth ⋅ Phone (02233) 604-0 ⋅ Telefax (02233) 604-222 ⋅ Telex 17 223 332 LHPCGN D © by Leybold Didactic GmbH Printed in the Federal Republic of Germany Technical alterations reserved LEYBOLD Physics Leaflets P6.3.3.1