正在加载图片...
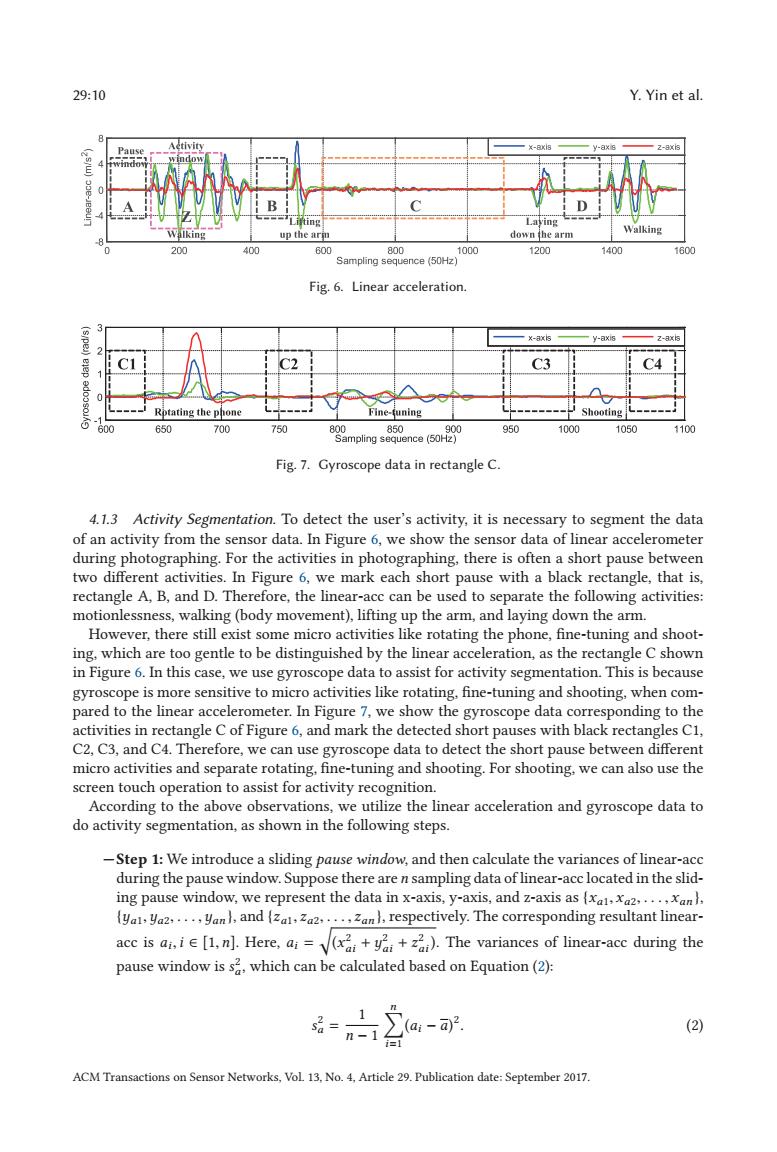
29:10 Y.Yin et al. Aetivity D Laying Walking up the arm down the arm Walking 200 400 600 800 000 1200 1400 1600 Sampling sequence (50Hz) Fig.6.Linear acceleration. ”y-aXs C3 C4 Rptating the phone Fine-和ning Shooting 600 650 700 750 80 850 900 950 1000 1050 1100 Sampling sequence (50Hz) Fig.7.Gyroscope data in rectangle C. 4.1.3 Activity Segmentation.To detect the user's activity,it is necessary to segment the data of an activity from the sensor data.In Figure 6,we show the sensor data of linear accelerometer during photographing.For the activities in photographing,there is often a short pause between two different activities.In Figure 6,we mark each short pause with a black rectangle,that is, rectangle A,B,and D.Therefore,the linear-acc can be used to separate the following activities: motionlessness,walking(body movement),lifting up the arm,and laying down the arm. However,there still exist some micro activities like rotating the phone,fine-tuning and shoot- ing,which are too gentle to be distinguished by the linear acceleration,as the rectangle C shown in Figure 6.In this case,we use gyroscope data to assist for activity segmentation.This is because gyroscope is more sensitive to micro activities like rotating,fine-tuning and shooting,when com- pared to the linear accelerometer.In Figure 7,we show the gyroscope data corresponding to the activities in rectangle C of Figure 6,and mark the detected short pauses with black rectangles C1, C2,C3,and C4.Therefore,we can use gyroscope data to detect the short pause between different micro activities and separate rotating,fine-tuning and shooting.For shooting,we can also use the screen touch operation to assist for activity recognition. According to the above observations,we utilize the linear acceleration and gyroscope data to do activity segmentation,as shown in the following steps. -Step 1:We introduce a sliding pause window,and then calculate the variances of linear-acc during the pause window.Suppose there are n sampling data of linear-acc located in the slid- ing pause window,we represent the data in x-axis,y-axis,and z-axis as {xa,xa2,...,xan. yal,ya2,...,yanl,and (zal,za2.....zan),respectively.The corresponding resultant linear- acc is ai,ie [1.n].Here,ai=y).The variances of linear-acc during the pause window is s2.which can be calculated based on Equation(2): 后= n-1 ai-a)2. (2) ACM Transactions on Sensor Networks,Vol 13.No.4,Article 29.Publication date:September 201729:10 Y. Yin et al. Fig. 6. Linear acceleration. Fig. 7. Gyroscope data in rectangle C. 4.1.3 Activity Segmentation. To detect the user’s activity, it is necessary to segment the data of an activity from the sensor data. In Figure 6, we show the sensor data of linear accelerometer during photographing. For the activities in photographing, there is often a short pause between two different activities. In Figure 6, we mark each short pause with a black rectangle, that is, rectangle A, B, and D. Therefore, the linear-acc can be used to separate the following activities: motionlessness, walking (body movement), lifting up the arm, and laying down the arm. However, there still exist some micro activities like rotating the phone, fine-tuning and shooting, which are too gentle to be distinguished by the linear acceleration, as the rectangle C shown in Figure 6. In this case, we use gyroscope data to assist for activity segmentation. This is because gyroscope is more sensitive to micro activities like rotating, fine-tuning and shooting, when compared to the linear accelerometer. In Figure 7, we show the gyroscope data corresponding to the activities in rectangle C of Figure 6, and mark the detected short pauses with black rectangles C1, C2, C3, and C4. Therefore, we can use gyroscope data to detect the short pause between different micro activities and separate rotating, fine-tuning and shooting. For shooting, we can also use the screen touch operation to assist for activity recognition. According to the above observations, we utilize the linear acceleration and gyroscope data to do activity segmentation, as shown in the following steps. —Step 1: We introduce a sliding pause window, and then calculate the variances of linear-acc during the pause window. Suppose there are n sampling data of linear-acc located in the sliding pause window, we represent the data in x-axis, y-axis, and z-axis as {xa1, xa2,..., xan }, {ya1,ya2,...,yan }, and {za1, za2,..., zan }, respectively. The corresponding resultant linearacc is ai,i ∈ [1,n]. Here, ai = (x2 ai + y2 ai + z2 ai ). The variances of linear-acc during the pause window is s2 a, which can be calculated based on Equation (2): s2 a = 1 n − 1 n i=1 (ai − a) 2 . (2) ACM Transactions on Sensor Networks, Vol. 13, No. 4, Article 29. Publication date: September 2017.��