正在加载图片...
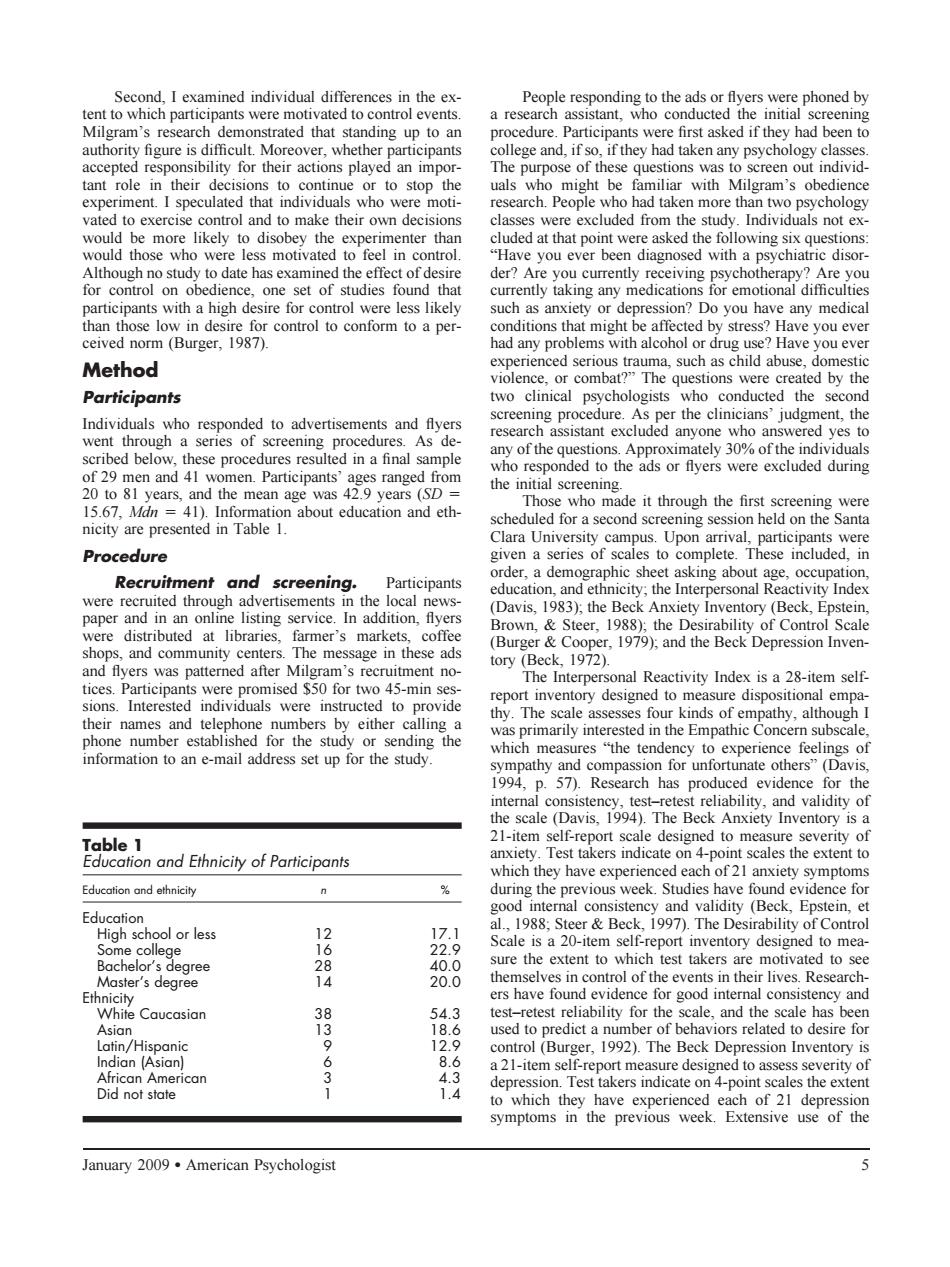
eexamined individual dierencesto the mo People wh ded from tn mo would be more likely to disobe Are one set of studies di函 than those low inde nditions that ceived norm (Burger,1987 ith alcoho Have you ev Method Participants who nd Individuals whe ud. to advertis series of d ves to nts' the mean age years(S eth nicity are presented in Table 1. scheduled for a second scre Clara Unive Upon Procedure Recruitment and screening Participants t asking about age. farmer's markets ,1972 ven were promised s for two 45-mins The Interpers onal Reactivity Index is a 2-item self de their numbers by either calling The scale es four pathy,athou r the stud rmrily inte na sympathy and(Davi 1994, 57).Research has prod )The Beck Anxiety Inventon E8berdnandEhntcyofPoriciponi Ed h symptom nternal co and Educatio Hligh school or les 3。 Steer&Bec 1997).The D ontr 2684 sure the extent to which test takers are motivated to see 20.0 ves White Caucasian 得 543 es cale and the s ale has b (Bur er,1992).The Beck Dep car 43 asure design to which they ave experience symptoms in the previous week xtensive use of the January 2009.American Psychologist Second, I examined individual differences in the extent to which participants were motivated to control events. Milgram’s research demonstrated that standing up to an authority figure is difficult. Moreover, whether participants accepted responsibility for their actions played an important role in their decisions to continue or to stop the experiment. I speculated that individuals who were motivated to exercise control and to make their own decisions would be more likely to disobey the experimenter than would those who were less motivated to feel in control. Although no study to date has examined the effect of desire for control on obedience, one set of studies found that participants with a high desire for control were less likely than those low in desire for control to conform to a perceived norm (Burger, 1987). Method Participants Individuals who responded to advertisements and flyers went through a series of screening procedures. As described below, these procedures resulted in a final sample of 29 men and 41 women. Participants’ ages ranged from 20 to 81 years, and the mean age was 42.9 years (SD 15.67, Mdn 41). Information about education and ethnicity are presented in Table 1. Procedure Recruitment and screening. Participants were recruited through advertisements in the local newspaper and in an online listing service. In addition, flyers were distributed at libraries, farmer’s markets, coffee shops, and community centers. The message in these ads and flyers was patterned after Milgram’s recruitment notices. Participants were promised $50 for two 45-min sessions. Interested individuals were instructed to provide their names and telephone numbers by either calling a phone number established for the study or sending the information to an e-mail address set up for the study. People responding to the ads or flyers were phoned by a research assistant, who conducted the initial screening procedure. Participants were first asked if they had been to college and, if so, if they had taken any psychology classes. The purpose of these questions was to screen out individuals who might be familiar with Milgram’s obedience research. People who had taken more than two psychology classes were excluded from the study. Individuals not excluded at that point were asked the following six questions: “Have you ever been diagnosed with a psychiatric disorder? Are you currently receiving psychotherapy? Are you currently taking any medications for emotional difficulties such as anxiety or depression? Do you have any medical conditions that might be affected by stress? Have you ever had any problems with alcohol or drug use? Have you ever experienced serious trauma, such as child abuse, domestic violence, or combat?” The questions were created by the two clinical psychologists who conducted the second screening procedure. As per the clinicians’ judgment, the research assistant excluded anyone who answered yes to any of the questions. Approximately 30% of the individuals who responded to the ads or flyers were excluded during the initial screening. Those who made it through the first screening were scheduled for a second screening session held on the Santa Clara University campus. Upon arrival, participants were given a series of scales to complete. These included, in order, a demographic sheet asking about age, occupation, education, and ethnicity; the Interpersonal Reactivity Index (Davis, 1983); the Beck Anxiety Inventory (Beck, Epstein, Brown, & Steer, 1988); the Desirability of Control Scale (Burger & Cooper, 1979); and the Beck Depression Inventory (Beck, 1972). The Interpersonal Reactivity Index is a 28-item selfreport inventory designed to measure dispositional empathy. The scale assesses four kinds of empathy, although I was primarily interested in the Empathic Concern subscale, which measures “the tendency to experience feelings of sympathy and compassion for unfortunate others” (Davis, 1994, p. 57). Research has produced evidence for the internal consistency, test–retest reliability, and validity of the scale (Davis, 1994). The Beck Anxiety Inventory is a 21-item self-report scale designed to measure severity of anxiety. Test takers indicate on 4-point scales the extent to which they have experienced each of 21 anxiety symptoms during the previous week. Studies have found evidence for good internal consistency and validity (Beck, Epstein, et al., 1988; Steer & Beck, 1997). The Desirability of Control Scale is a 20-item self-report inventory designed to measure the extent to which test takers are motivated to see themselves in control of the events in their lives. Researchers have found evidence for good internal consistency and test–retest reliability for the scale, and the scale has been used to predict a number of behaviors related to desire for control (Burger, 1992). The Beck Depression Inventory is a 21-item self-report measure designed to assess severity of depression. Test takers indicate on 4-point scales the extent to which they have experienced each of 21 depression symptoms in the previous week. Extensive use of the Table 1 Education and Ethnicity of Participants Education and ethnicity n % Education High school or less 12 17.1 Some college 16 22.9 Bachelor’s degree 28 40.0 Master’s degree 14 20.0 Ethnicity White Caucasian 38 54.3 Asian 13 18.6 Latin/Hispanic 9 12.9 Indian (Asian) 6 8.6 African American 3 4.3 Did not state 1 1.4 January 2009 ● American Psychologist 5