正在加载图片...
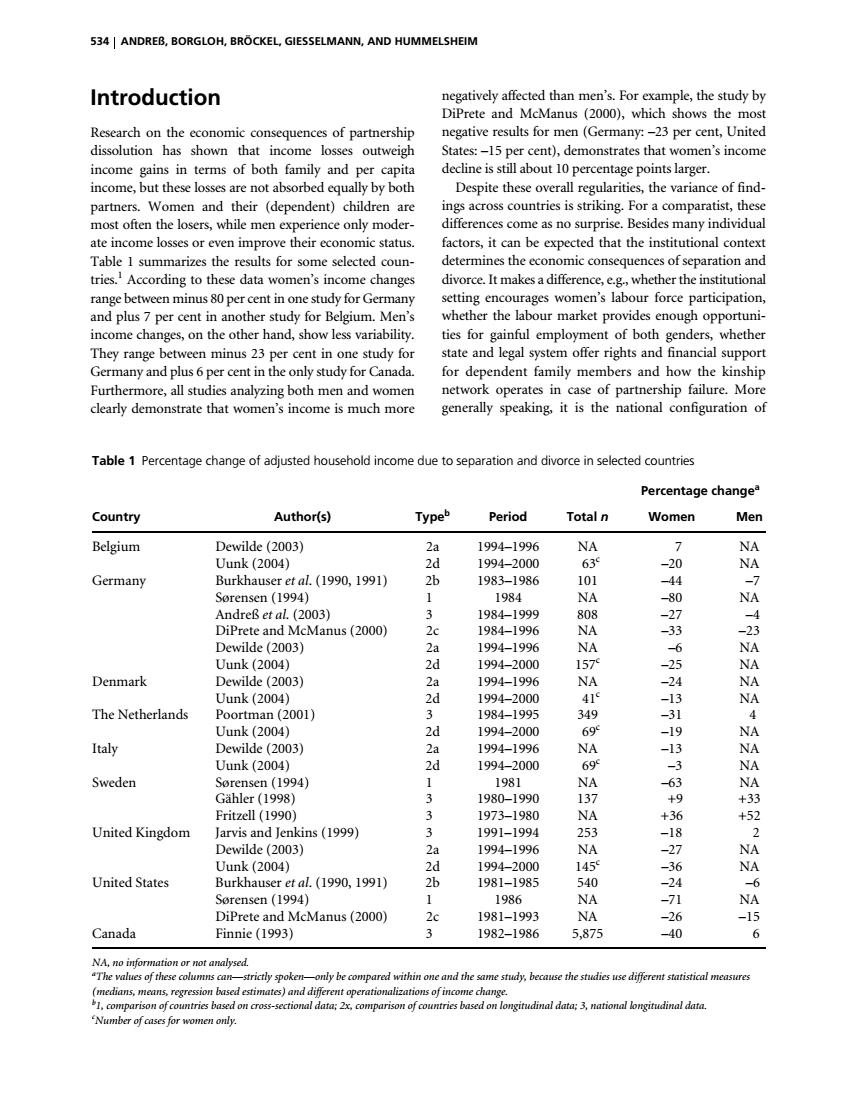
534 ANDREB,BORGLOH,BROCKEL,GIESSELMANN,AND HUMMELSHEIM Introduction negatively affected than men's.For example,the study by DiPrete and McManus (2000),which shows the most Research on the economic consequences of partnership negative results for men(Germany:-23 per cent,United dissolution has shown that income losses outweigh States:-15 per cent),demonstrates that women's income income gains in terms of both family and per capita decline is still about 10 percentage points larger. income,but these losses are not absorbed equally by both Despite these overall regularities,the variance of find- partners.Women and their (dependent)children are ings across countries is striking.For a comparatist,these most often the losers,while men experience only moder- differences come as no surprise.Besides many individual ate income losses or even improve their economic status. factors,it can be expected that the institutional context Table I summarizes the results for some selected coun- determines the economic consequences of separation and tries.According to these data women's income changes divorce.It makes a difference,e.g.whether the institutional range between minus 80 per cent in one study for Germany setting encourages women's labour force participation, and plus 7 per cent in another study for Belgium.Men's whether the labour market provides enough opportuni- income changes,on the other hand,show less variability. ties for gainful employment of both genders,whether They range between minus 23 per cent in one study for state and legal system offer rights and financial support Germany and plus 6 per cent in the only study for Canada. for dependent family members and how the kinship Furthermore,all studies analyzing both men and women network operates in case of partnership failure.More clearly demonstrate that women's income is much more generally speaking,it is the national configuration of Table 1 Percentage change of adjusted household income due to separation and divorce in selected countries Percentage changea Country Author(s) Typeb Period Total n Women Men Belgium Dewilde (2003) 2a 1994-1996 NA 7 NA Uunk(2004) 2d 1994-2000 63 -20 NA Germany Burkhauser et al.(1990,1991) 2b 1983-1986 101 -44 -7 Sorensen (1994) 1 1984 NA -80 NA AndreB et al.(2003) 3 1984-1999 808 -27 DiPrete and McManus(2000) 2c 1984-1996 NA -33 -23 Dewilde(2003) 2a 1994-1996 NA NA Uunk(2004) 2d 1994-2000 157 -25 NA Denmark Dewilde (2003) 2a 1994-1996 NA -24 Uunk(2004) 2d 1994-2000 41 The Netherlands Poortman(2001) 3 1984-1995 349 -31 Uunk(2004) 2d 1994-2000 69 -19 A Italy Dewilde(2003) 2a 1994-1996 NA 3 Uunk(2004) 2d 1994-2000 69 Sweden Sorensen (1994) 1 1981 NA A Gahler (1998) 3 1980-1990 137 +9 +3 Fritzell(1990) 3 1973-1980 NA +36 United Kingdom Jarvis and Jenkins(1999) 3 1991-1994 253 -18 2 Dewilde(2003) 2 1994-1996 NA -27 Uunk(2004) 2d 1994-2000 145 -36 NA United States Burkhauser et al.(1990,1991) 1981-1985 540 -24 -6 Sorensen (1994) 1 1986 NA -71 NA DiPrete and McManus(2000) 2c 1981-1993 NA -26 -15 Canada Finnie(1993) 3 1982-1986 5,875 -40 6 NA,no information or not analysed. "The values of these columns can-strictly spoken-only be compared within one and the same study,because the studies use different statistical measures (medians,means,regression based estimates)and different operationalizations of income change. 1.comparison of countries based on cross-sectional data;2x,comparison of countries based on longitudinal data;3,national longitudinal data Number of cases for women only.534 ANDREß, BORGLOH, BRÖCKEL, GIESSELMANN, AND HUMMELSHEIM Introduction Research on the economic consequences of partnership dissolution has shown that income losses outweigh income gains in terms of both family and per capita income, but these losses are not absorbed equally by both partners. Women and their (dependent) children are most often the losers, while men experience only moderate income losses or even improve their economic status. Table 1 summarizes the results for some selected countries.1 According to these data women’s income changes range between minus 80 per cent in one study for Germany and plus 7 per cent in another study for Belgium. Men’s income changes, on the other hand, show less variability. They range between minus 23 per cent in one study for Germany and plus 6 per cent in the only study for Canada. Furthermore, all studies analyzing both men and women clearly demonstrate that women’s income is much more negatively affected than men’s. For example, the study by DiPrete and McManus (2000), which shows the most negative results for men (Germany: –23 per cent, United States: –15 per cent), demonstrates that women’s income decline is still about 10 percentage points larger. Despite these overall regularities, the variance of findings across countries is striking. For a comparatist, these differences come as no surprise. Besides many individual factors, it can be expected that the institutional context determines the economic consequences of separation and divorce. It makes a difference, e.g., whether the institutional setting encourages women’s labour force participation, whether the labour market provides enough opportunities for gainful employment of both genders, whether state and legal system offer rights and financial support for dependent family members and how the kinship network operates in case of partnership failure. More generally speaking, it is the national configuration of Table 1 Percentage change of adjusted household income due to separation and divorce in selected countries NA, no information or not analysed. a The values of these columns can—strictly spoken—only be compared within one and the same study, because the studies use different statistical measures (medians, means, regression based estimates) and different operationalizations of income change. b 1, comparison of countries based on cross-sectional data; 2x, comparison of countries based on longitudinal data; 3, national longitudinal data. c Number of cases for women only. Percentage changea Country Author(s) Typeb Period Total n Women Men Belgium Dewilde (2003) 2a 1994–1996 NA 7 NA Uunk (2004) 2d 1994–2000 63c –20 NA Germany Burkhauser et al. (1990, 1991) 2b 1983–1986 101 –44 –7 Sørensen (1994) 1 1984 NA –80 NA Andreß et al. (2003) 3 1984–1999 808 –27 –4 DiPrete and McManus (2000) 2c 1984–1996 NA –33 –23 Dewilde (2003) 2a 1994–1996 NA –6 NA Uunk (2004) 2d 1994–2000 157c –25 NA Denmark Dewilde (2003) 2a 1994–1996 NA –24 NA Uunk (2004) 2d 1994–2000 41c –13 NA The Netherlands Poortman (2001) 3 1984–1995 349 –31 4 Uunk (2004) 2d 1994–2000 69c –19 NA Italy Dewilde (2003) 2a 1994–1996 NA –13 NA Uunk (2004) 2d 1994–2000 69c –3 NA Sweden Sørensen (1994) 1 1981 NA –63 NA Gähler (1998) 3 1980–1990 137 +9 +33 Fritzell (1990) 3 1973–1980 NA +36 +52 United Kingdom Jarvis and Jenkins (1999) 3 1991–1994 253 –18 2 Dewilde (2003) 2a 1994–1996 NA –27 NA Uunk (2004) 2d 1994–2000 145c –36 NA United States Burkhauser et al. (1990, 1991) 2b 1981–1985 540 –24 –6 Sørensen (1994) 1 1986 NA –71 NA DiPrete and McManus (2000) 2c 1981–1993 NA –26 –15 Canada Finnie (1993) 3 1982–1986 5,875 –40 6