正在加载图片...
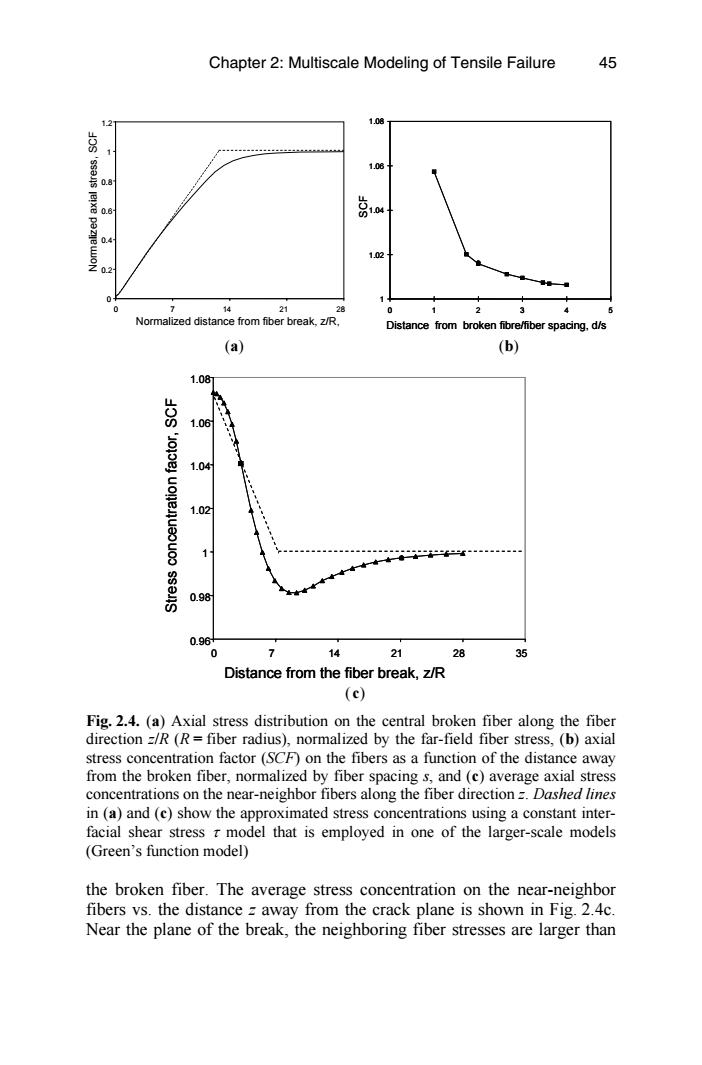
Chapter 2:Multiscale Modeling of Tensile Failure 45 1.08 1 1.06 0.8 Qe, 1.04 1.02 0 14 21 28 0 Normalized distance from fiber break,z/R, Distance from broken fibre/fiber spacing,d/s (a) (b) 1.08 1.06 1.04 1.02 0.98 0.96 14 21 28 35 Distance from the fiber break,z/R (c) Fig.2.4.(a)Axial stress distribution on the central broken fiber along the fiber direction z/R(R=fiber radius),normalized by the far-field fiber stress,(b)axial stress concentration factor (SCF)on the fibers as a function of the distance away from the broken fiber,normalized by fiber spacing s,and (c)average axial stress concentrations on the near-neighbor fibers along the fiber direction =Dashed lines in (a)and (c)show the approximated stress concentrations using a constant inter- facial shear stress r model that is employed in one of the larger-scale models (Green's function model) the broken fiber.The average stress concentration on the near-neighbor fibers vs.the distance z away from the crack plane is shown in Fig.2.4c. Near the plane of the break,the neighboring fiber stresses are larger than0 0.2 0.4 0.6 0.8 1 1.2 0 7 14 21 28 Normalized distance from fiber break, z/R, Normalized axial stress, SCF 1 1.02 1.04 1.06 1.08 012345 Distance from broken fibre/fiber spacing, d/s SCF 1 1.02 1.04 1.06 1.08 012345 Distance from broken fibre/fiber spacing, d/s SCF (a) (b) 0.96 0.98 1 1.02 1.04 1.06 1.08 0 7 14 21 28 35 Distance from the fiber break, z/R Stress concentration factor, SCF 0.96 0.98 1 1.02 1.04 1.06 1.08 0 7 14 21 28 35 Distance from the fiber break, z/R Stress concentration factor, SCF ( c) Fig. 2.4. (a) Axial stress distribution on the central broken fiber along the fiber direction z/R (R = fiber radius), normalized by the far-field fiber stress, (b) axial stress concentration factor (SCF) on the fibers as a function of the distance away from the broken fiber, normalized by fiber spacing s, and (c) average axial stress concentrations on the near-neighbor fibers along the fiber direction z. Dashed lines in (a) and (c) show the approximated stress concentrations using a constant interfacial shear stress τ model that is employed in one of the larger-scale models (Green’s function model) the broken fiber. The average stress concentration on the near-neighbor fibers vs. the distance z away from the crack plane is shown in Fig. 2.4c. Near the plane of the break, the neighboring fiber stresses are larger than Chapter 2: Multiscale Modeling of Tensile Failure 45