正在加载图片...
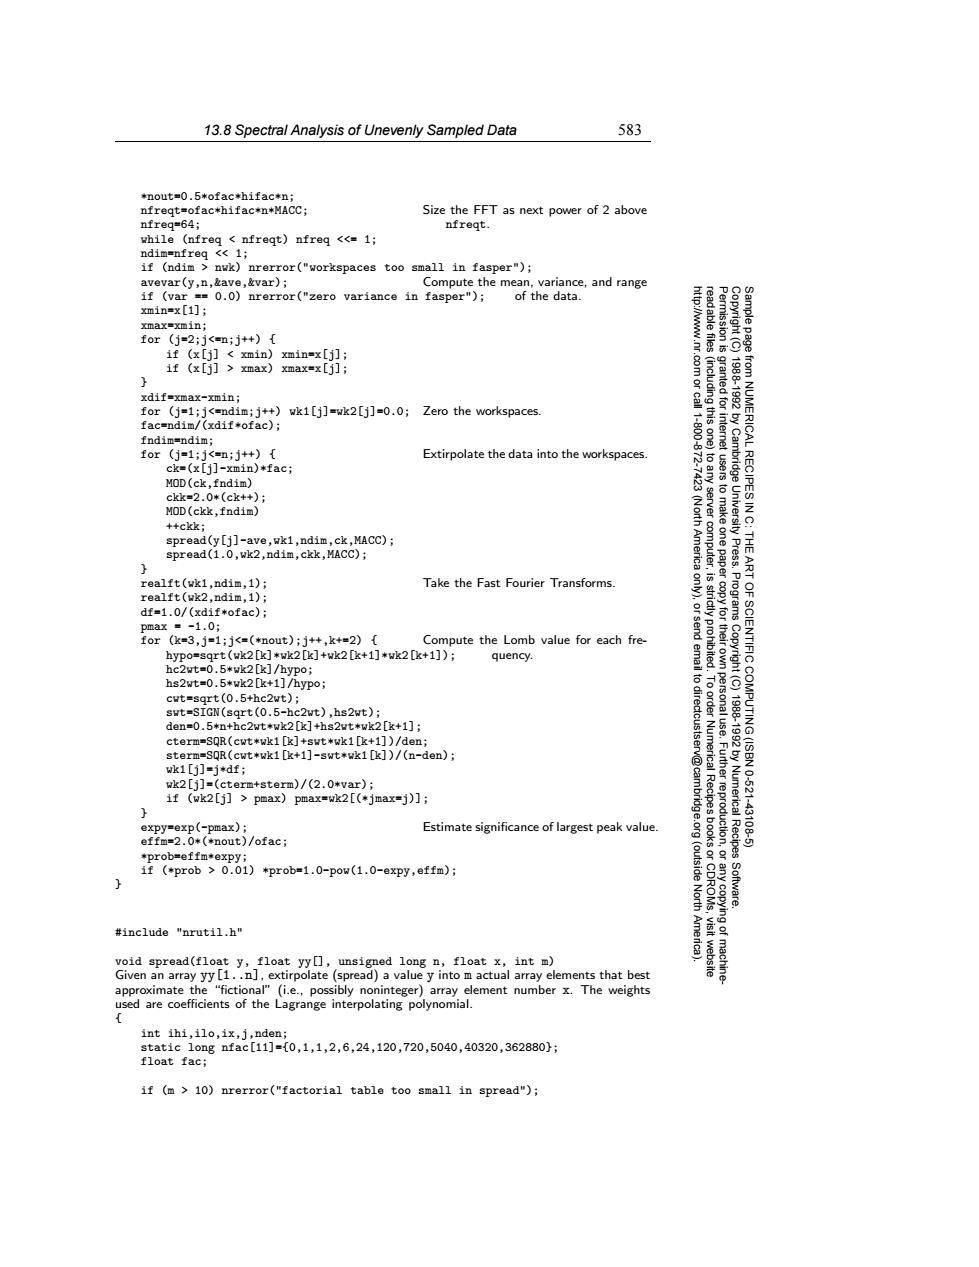
13.8 Spectral Analysis of Unevenly Sampled Data 583 *nout=0.5*ofac*hifac*n; nfreqt=ofac*hifac*n*MACC; Size the FFT as next power of 2 above nfreq=64; nfreqt. while (nfreq nfreqt)nfreq <<1; ndim=nfreg <<1; if (ndim nwk)nrerror("workspaces too small in fasper"); avevar(y,n,kave,&var); Compute the mean,variance,and range if (var ==0.0)nrerror("zero variance in fasper"); of the data. xmin=x[1]; xmax=xmin; for (j=2;j<mn;j++){ if (x[i]xmin)xmin=x[i]; if (x[j]xmax) xmax=x[] xdif=xmax-xmin: 19881992 for (j=1;j<=ndim;j++)wk1[j]=wk2[j]=0.0;Zero the workspaces. fac=ndim/(xdif*ofac); 1.800 fndim=ndim; for (j=1;j<=n;j++){ Extirpolate the data into the workspaces. ck=(x[j]-xmin)*fac; Cambridge from NUMERICAL RECIPES I MOD(ck,fndim) ck=2.0*(ck++); MOD(ckk,fndim) ++ck; spread(y[j]-ave,wk1,ndim,ck,MACC); spread(1.0,wk2,ndim,ckk,MACC); America server computer, (Nor to make one paper UnN电.t THE ART realft(wk1,ndim,1); Take the Fast Fourier Transforms realft(wk2,ndim,1); df=1.0/(xdif*ofac); Programs pmax=-1.0; for(k=3,j=1;j<=(*nout);j+,k+=2) Compute the Lomb value for each fre- hypo=sqrt (wk2[k]*wk2[k]+wk2[k+1]*wk2[k+1]); quency. hc2wt=0.5*wk2[k]/hypo; hs2wt=0.5*wk2[k+1]/hypo; to dir cwt=sgrt(0.5+hc2wt); swt=SIGN(sqrt(0.5-hc2wt),hs2wt); den=0.5*n+hc2wt*wk2[k]+hs2ut*wk2[k+1]; 18881920 OF SCIENTIFIC COMPUTING(ISBN cterm=SQR(cwt*wk1 [k]+swt*wk1[k+1])/den; sterm=SQR(cwt*wk1[k+1]-swt*wk1[k])/(n-den); wk1[j]=j*df; wk2[j]=(cterm+sterm)/(2.0*var); % Numerical Recipes 10-621 if (wk2[j]pmax)pmax=wk2[(*jmax=j)]; expy=exp(-pmax); Estimate significance of largest peak value. -43108 effm=2.0*(*nout)/ofac; *prob=effm*expy; if (*prob >0.01)*prob=1.0-pow(1.0-expy,effm); (outside North Software. #include "nrutil.h" void spread(float y,float yy],unsigned long n,float x,int m) Given an array yy[1..n],extirpolate(spread)a value y into m actual array elements that best approximate the "fictional"(i.e.,possibly noninteger)array element number x.The weights used are coefficients of the Lagrange interpolating polynomial. int ihi,ilo,ix,j,nden; stat1c1 ong nfac[11]=[0,1,1,2,6,24,120,720,5040,40320,362880]; float fac; if (m 10)nrerror("factorial table too small in spread");13.8 Spectral Analysis of Unevenly Sampled Data 583 Permission is granted for internet users to make one paper copy for their own personal use. Further reproduction, or any copyin Copyright (C) 1988-1992 by Cambridge University Press. Programs Copyright (C) 1988-1992 by Numerical Recipes Software. Sample page from NUMERICAL RECIPES IN C: THE ART OF SCIENTIFIC COMPUTING (ISBN 0-521-43108-5) g of machinereadable files (including this one) to any server computer, is strictly prohibited. To order Numerical Recipes books or CDROMs, visit website http://www.nr.com or call 1-800-872-7423 (North America only), or send email to directcustserv@cambridge.org (outside North America). *nout=0.5*ofac*hifac*n; nfreqt=ofac*hifac*n*MACC; Size the FFT as next power of 2 above nfreq=64; nfreqt. while (nfreq < nfreqt) nfreq <<= 1; ndim=nfreq << 1; if (ndim > nwk) nrerror("workspaces too small in fasper"); avevar(y,n,&ave,&var); Compute the mean, variance, and range if (var == 0.0) nrerror("zero variance in fasper"); of the data. xmin=x[1]; xmax=xmin; for (j=2;j<=n;j++) { if (x[j] < xmin) xmin=x[j]; if (x[j] > xmax) xmax=x[j]; } xdif=xmax-xmin; for (j=1;j<=ndim;j++) wk1[j]=wk2[j]=0.0; Zero the workspaces. fac=ndim/(xdif*ofac); fndim=ndim; for (j=1;j<=n;j++) { Extirpolate the data into the workspaces. ck=(x[j]-xmin)*fac; MOD(ck,fndim) ckk=2.0*(ck++); MOD(ckk,fndim) ++ckk; spread(y[j]-ave,wk1,ndim,ck,MACC); spread(1.0,wk2,ndim,ckk,MACC); } realft(wk1,ndim,1); Take the Fast Fourier Transforms. realft(wk2,ndim,1); df=1.0/(xdif*ofac); pmax = -1.0; for (k=3,j=1;j<=(*nout);j++,k+=2) { Compute the Lomb value for each frehypo=sqrt(wk2[k]*wk2[k]+wk2[k+1]*wk2[k+1]); quency. hc2wt=0.5*wk2[k]/hypo; hs2wt=0.5*wk2[k+1]/hypo; cwt=sqrt(0.5+hc2wt); swt=SIGN(sqrt(0.5-hc2wt),hs2wt); den=0.5*n+hc2wt*wk2[k]+hs2wt*wk2[k+1]; cterm=SQR(cwt*wk1[k]+swt*wk1[k+1])/den; sterm=SQR(cwt*wk1[k+1]-swt*wk1[k])/(n-den); wk1[j]=j*df; wk2[j]=(cterm+sterm)/(2.0*var); if (wk2[j] > pmax) pmax=wk2[(*jmax=j)]; } expy=exp(-pmax); Estimate significance of largest peak value. effm=2.0*(*nout)/ofac; *prob=effm*expy; if (*prob > 0.01) *prob=1.0-pow(1.0-expy,effm); } #include "nrutil.h" void spread(float y, float yy[], unsigned long n, float x, int m) Given an array yy[1..n], extirpolate (spread) a value y into m actual array elements that best approximate the “fictional” (i.e., possibly noninteger) array element number x. The weights used are coefficients of the Lagrange interpolating polynomial. { int ihi,ilo,ix,j,nden; static long nfac[11]={0,1,1,2,6,24,120,720,5040,40320,362880}; float fac; if (m > 10) nrerror("factorial table too small in spread");