正在加载图片...
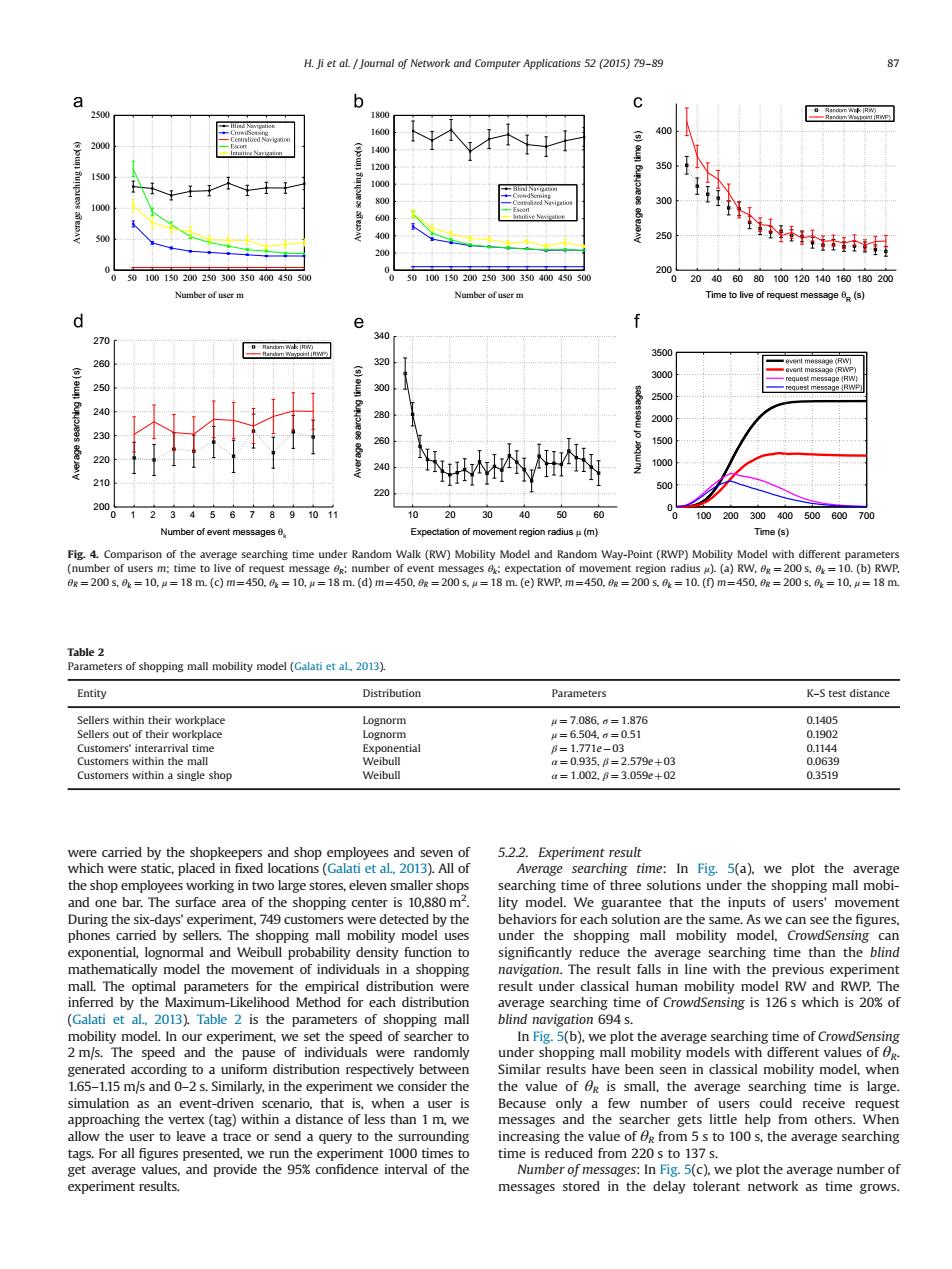
H.Ji et al Journal of Network and Computer Applications 52 (2015)79-89 87 9 b 20 1800 巴mad 1600 00 200 1400 1200 350 150 100 300 400 250 200 INihnt 200 50 100150200250300350400450 0 50 100 150200250300350400450500 20 60 80100120140180180200 Number of user m Number of user m Time to live of request message (s) d e 270 340 50 260 320 3000 age (RW 250l 300 2500 280 2000 230 260 1500 220 240 1000 o 500 220 200 0 1 234567891011 20 40 50 60 100 200300400500600700 Number of event messages Expe nt region radiusμ(m Time(s) Fig.4.Comparison of the average searching time under Random Walk(RW)Mobility Model and Random Way-Point(RWP)Mobility Model with different parameters (number of users m:time to live of request message 0g:number of event messages a:expectation of movement region radius )(a)RW.ag=200 s.=10.(b)RWP r=200s.0=10.μ=18m.(c)m=450.=10.4=18m.(d)m=450.R=200s.=18m(e)RWP.m=450.R=200s.a=10.(0m=450.0R=200s.a=10.a=18m Table 2 Parameters of shopping mall mobility model (Galati et aL,2013). Entity Distribution Parameters K-S test distance Sellers within their workplace Lognorm 4=7.086.a=1.876 0.1405 Sellers out of their workplace Lognorm 4=6.504.a=0.51 0.1902 Customers'interarrival time Exponential B=1.771e-03 0.1144 Customers within the mall Weibull a=0.935,B=2.579e+03 0.0639 Customers within a single shop Weibull a=1.002.B=3.059e+02 0.3519 were carried by the shopkeepers and shop employees and seven of 5.2.2.Experiment result which were static,placed in fixed locations (Galati et al.2013).All of Average searching time:In Fig.5(a).we plot the average the shop employees working in two large stores,eleven smaller shops searching time of three solutions under the shopping mall mobi- and one bar.The surface area of the shopping center is 10,880 m2. lity model.We guarantee that the inputs of users'movement During the six-days'experiment,749 customers were detected by the behaviors for each solution are the same.As we can see the figures. phones carried by sellers.The shopping mall mobility model uses under the shopping mall mobility model,Crowdsensing can exponential,lognormal and Weibull probability density function to significantly reduce the average searching time than the blind mathematically model the movement of individuals in a shopping navigation.The result falls in line with the previous experiment mall.The optimal parameters for the empirical distribution were result under classical human mobility model RW and RWP.The inferred by the Maximum-Likelihood Method for each distribution average searching time of CrowdSensing is 126s which is 20%of (Galati et al,2013).Table 2 is the parameters of shopping mall blind navigation 694 s. mobility model.In our experiment,we set the speed of searcher to In Fig.5(b),we plot the average searching time of CrowdSensing 2 m/s.The speed and the pause of individuals were randomly under shopping mall mobility models with different values of og. generated according to a uniform distribution respectively between Similar results have been seen in classical mobility model,when 1.65-1.15 m/s and 0-2 s.Similarly,in the experiment we consider the the value of Og is small,the average searching time is large. simulation as an event-driven scenario,that is,when a user is Because only a few number of users could receive request approaching the vertex (tag)within a distance of less than 1 m,we messages and the searcher gets little help from others.When allow the user to leave a trace or send a query to the surrounding increasing the value of dg from 5s to 100 s,the average searching tags.For all figures presented,we run the experiment 1000 times to time is reduced from 220s to 137 s. get average values,and provide the 95%confidence interval of the Number of messages:In Fig.5(c),we plot the average number of experiment results. messages stored in the delay tolerant network as time grows.were carried by the shopkeepers and shop employees and seven of which were static, placed in fixed locations (Galati et al., 2013). All of the shop employees working in two large stores, eleven smaller shops and one bar. The surface area of the shopping center is 10,880 m2 . During the six-days' experiment, 749 customers were detected by the phones carried by sellers. The shopping mall mobility model uses exponential, lognormal and Weibull probability density function to mathematically model the movement of individuals in a shopping mall. The optimal parameters for the empirical distribution were inferred by the Maximum-Likelihood Method for each distribution (Galati et al., 2013). Table 2 is the parameters of shopping mall mobility model. In our experiment, we set the speed of searcher to 2 m/s. The speed and the pause of individuals were randomly generated according to a uniform distribution respectively between 1.65–1.15 m/s and 0–2 s. Similarly, in the experiment we consider the simulation as an event-driven scenario, that is, when a user is approaching the vertex (tag) within a distance of less than 1 m, we allow the user to leave a trace or send a query to the surrounding tags. For all figures presented, we run the experiment 1000 times to get average values, and provide the 95% confidence interval of the experiment results. 5.2.2. Experiment result Average searching time: In Fig. 5(a), we plot the average searching time of three solutions under the shopping mall mobility model. We guarantee that the inputs of users' movement behaviors for each solution are the same. As we can see the figures, under the shopping mall mobility model, CrowdSensing can significantly reduce the average searching time than the blind navigation. The result falls in line with the previous experiment result under classical human mobility model RW and RWP. The average searching time of CrowdSensing is 126 s which is 20% of blind navigation 694 s. In Fig. 5(b), we plot the average searching time of CrowdSensing under shopping mall mobility models with different values of θR. Similar results have been seen in classical mobility model, when the value of θR is small, the average searching time is large. Because only a few number of users could receive request messages and the searcher gets little help from others. When increasing the value of θR from 5 s to 100 s, the average searching time is reduced from 220 s to 137 s. Number of messages: In Fig. 5(c), we plot the average number of messages stored in the delay tolerant network as time grows. 0 50 100 150 200 250 300 350 400 450 500 0 500 1000 1500 2000 2500 Number of user m Average searching time(s) 0 50 100 150 200 250 300 350 400 450 500 0 200 400 600 800 1000 1200 1400 1600 1800 Number of user m Average searching time(s) 0 20 40 60 80 100 120 140 160 180 200 200 250 300 350 400 Time to live of request message θR (s) Average searching time (s) 0 1 2 3 4 5 6 7 8 9 10 11 200 210 220 230 240 250 260 270 Number of event messages θ Average searching time (s) 10 20 30 40 50 60 220 240 260 280 300 320 340 Expectation of movement region radius μ (m) Average searching time (s) 0 100 200 300 400 500 600 700 0 500 1000 1500 2000 2500 3000 3500 Time (s) Number of messages Fig. 4. Comparison of the average searching time under Random Walk (RW) Mobility Model and Random Way-Point (RWP) Mobility Model with different parameters (number of users m; time to live of request message θR; number of event messages θk; expectation of movement region radius μ). (a) RW, θR ¼ 200 s, θk ¼ 10. (b) RWP, θR ¼ 200 s, θk ¼ 10, μ ¼ 18 m. (c) m¼450, θk ¼ 10, μ ¼ 18 m. (d) m¼450, θR ¼ 200 s, μ ¼ 18 m. (e) RWP, m¼450, θR ¼ 200 s, θk ¼ 10. (f) m¼450, θR ¼ 200 s, θk ¼ 10, μ ¼ 18 m. Table 2 Parameters of shopping mall mobility model (Galati et al., 2013). Entity Distribution Parameters K–S test distance Sellers within their workplace Lognorm μ ¼ 7:086, σ ¼ 1:876 0.1405 Sellers out of their workplace Lognorm μ ¼ 6:504, σ ¼ 0:51 0.1902 Customers' interarrival time Exponential β ¼ 1:771e03 0.1144 Customers within the mall Weibull α ¼ 0:935, β ¼ 2:579eþ03 0.0639 Customers within a single shop Weibull α ¼ 1:002, β ¼ 3:059eþ02 0.3519 H. Ji et al. / Journal of Network and Computer Applications 52 (2015) 79–89 87