正在加载图片...

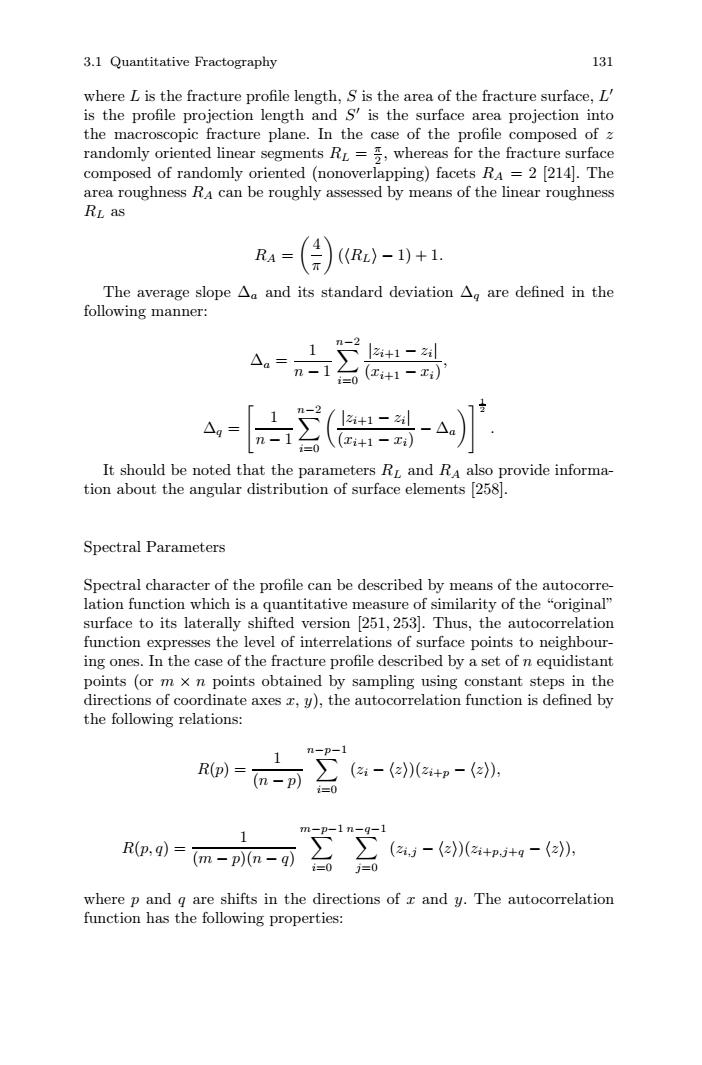
3.1 Quantitative Fractography 131 where L is the fracture profile length,S is the area of the fracture surface,L' is the profile projection length and S'is the surface area projection into the macroscopic fracture plane.In the case of the profile composed of z randomly oriented linear segments RL=,whereas for the fracture surface composed of randomly oriented (nonoverlapping)facets RA =2 [214.The area roughness RA can be roughly assessed by means of the linear roughness RL as RA (月)-)+. The average slope Aa and its standard deviation Ag are defined in the following manner: n-2 2+1-2 n-1 0(z+1-) 1 It should be noted that the parameters RL and RA also provide informa- tion about the angular distribution of surface elements [258. Spectral Parameters Spectral character of the profile can be described by means of the autocorre- lation function which is a quantitative measure of similarity of the "original" surface to its laterally shifted version 251,253.Thus,the autocorrelation function expresses the level of interrelations of surface points to neighbour- ing ones.In the case of the fracture profile described by a set of n equidistant points (or m x n points obtained by sampling using constant steps in the directions of coordinate axes z,y),the autocorrelation function is defined by the following relations: n-p-1 1 R(p)= (n-p) ∑(a-(a2+p-(》 = m-p-1n-q-1 1 R(p,q)=7 (m-p)(n-q) (a,1-(2)(+pj+g-(2) i=01=0 where p and g are shifts in the directions of z and y.The autocorrelation function has the following properties:3.1 Quantitative Fractography 131 where L is the fracture profile length, S is the area of the fracture surface, L is the profile projection length and S is the surface area projection into the macroscopic fracture plane. In the case of the profile composed of z randomly oriented linear segments RL = π 2 , whereas for the fracture surface composed of randomly oriented (nonoverlapping) facets RA = 2 [214]. The area roughness RA can be roughly assessed by means of the linear roughness RL as RA = 4 π (RL − 1) + 1. The average slope Δa and its standard deviation Δq are defined in the following manner: Δa = 1 n − 1 n −2 i=0 |zi+1 − zi| (xi+1 − xi) , Δq =
1 n − 1 n −2 i=0 |zi+1 − zi| (xi+1 − xi) − Δa
1 2 . It should be noted that the parameters RL and RA also provide information about the angular distribution of surface elements [258]. Spectral Parameters Spectral character of the profile can be described by means of the autocorrelation function which is a quantitative measure of similarity of the “original” surface to its laterally shifted version [251, 253]. Thus, the autocorrelation function expresses the level of interrelations of surface points to neighbouring ones. In the case of the fracture profile described by a set of n equidistant points (or m × n points obtained by sampling using constant steps in the directions of coordinate axes x, y), the autocorrelation function is defined by the following relations: R(p) = 1 (n − p) n− p−1 i=0 (zi − z)(zi+p − z), R(p, q) = 1 (m − p)(n − q) m−p−1 i=0 n− q−1 j=0 (zi,j − z)(zi+p,j+q − z), where p and q are shifts in the directions of x and y. The autocorrelation function has the following properties: