正在加载图片...

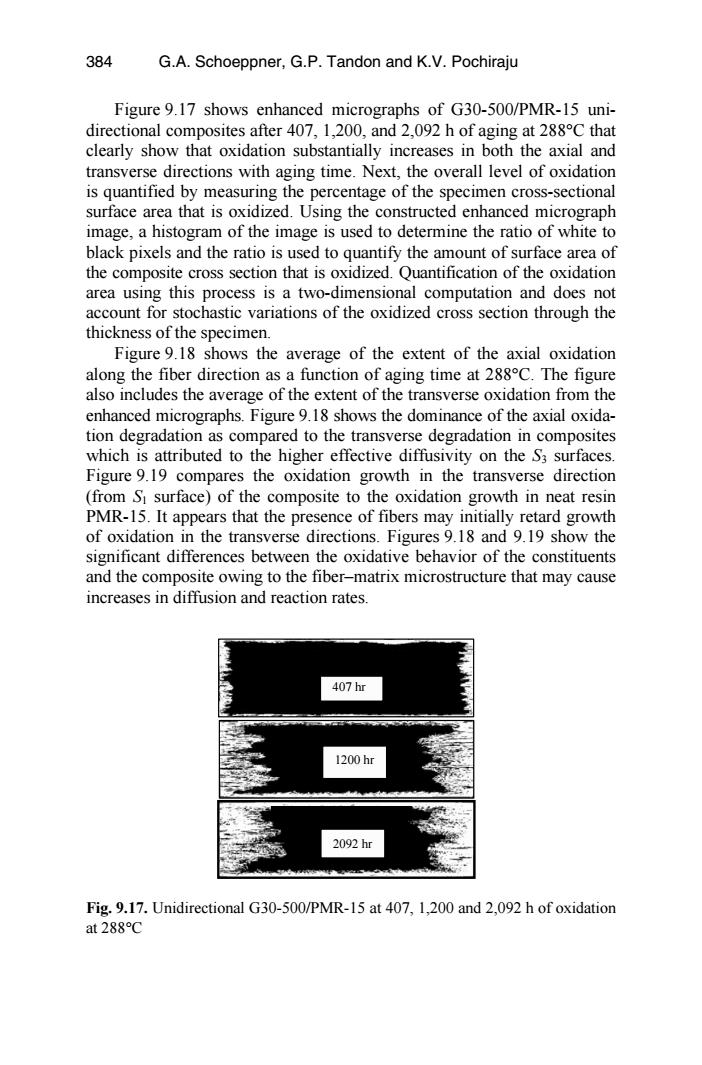
384 G.A.Schoeppner,G.P.Tandon and K.V.Pochiraju Figure 9.17 shows enhanced micrographs of G30-500/PMR-15 uni- directional composites after 407,1,200,and 2,092 h of aging at 288C that clearly show that oxidation substantially increases in both the axial and transverse directions with aging time.Next,the overall level of oxidation is quantified by measuring the percentage of the specimen cross-sectional surface area that is oxidized.Using the constructed enhanced micrograph image,a histogram of the image is used to determine the ratio of white to black pixels and the ratio is used to quantify the amount of surface area of the composite cross section that is oxidized.Quantification of the oxidation area using this process is a two-dimensional computation and does not account for stochastic variations of the oxidized cross section through the thickness of the specimen. Figure 9.18 shows the average of the extent of the axial oxidation along the fiber direction as a function of aging time at 288C.The figure also includes the average of the extent of the transverse oxidation from the enhanced micrographs.Figure 9.18 shows the dominance of the axial oxida- tion degradation as compared to the transverse degradation in composites which is attributed to the higher effective diffusivity on the S3 surfaces. Figure 9.19 compares the oxidation growth in the transverse direction (from S surface)of the composite to the oxidation growth in neat resin PMR-15.It appears that the presence of fibers may initially retard growth of oxidation in the transverse directions.Figures 9.18 and 9.19 show the significant differences between the oxidative behavior of the constituents and the composite owing to the fiber-matrix microstructure that may cause increases in diffusion and reaction rates. 407hr 1200hr 2092hr Fig.9.17.Unidirectional G30-500/PMR-15 at 407,1,200 and 2,092 h of oxidation at 288CFigure 9.17 shows enhanced micrographs of G30-500/PMR-15 unidirectional composites after 407, 1,200, and 2,092 h of aging at 288°C that clearly show that oxidation substantially increases in both the axial and transverse directions with aging time. Next, the overall level of oxidation is quantified by measuring the percentage of the specimen cross-sectional surface area that is oxidized. Using the constructed enhanced micrograph image, a histogram of the image is used to determine the ratio of white to black pixels and the ratio is used to quantify the amount of surface area of the composite cross section that is oxidized. Quantification of the oxidation area using this process is a two-dimensional computation and does not account for stochastic variations of the oxidized cross section through the thickness of the specimen. Figure 9.18 shows the average of the extent of the axial oxidation along the fiber direction as a function of aging time at 288°C. The figure also includes the average of the extent of the transverse oxidation from the enhanced micrographs. Figure 9.18 shows the dominance of the axial oxidation degradation as compared to the transverse degradation in composites which is attributed to the higher effective diffusivity on the S3 surfaces. Figure 9.19 compares the oxidation growth in the transverse direction (from S1 surface) of the composite to the oxidation growth in neat resin PMR-15. It appears that the presence of fibers may initially retard growth of oxidation in the transverse directions. Figures 9.18 and 9.19 show the significant differences between the oxidative behavior of the constituents and the composite owing to the fiber–matrix microstructure that may cause increases in diffusion and reaction rates. Fig. 9.17. Unidirectional G30-500/PMR-15 at 407, 1,200 and 2,092 h of oxidation at 288°C 407 hr 2092 hr 1200 hr 384 G.A. Schoeppner, G.P. Tandon and K.V. Pochiraju