正在加载图片...
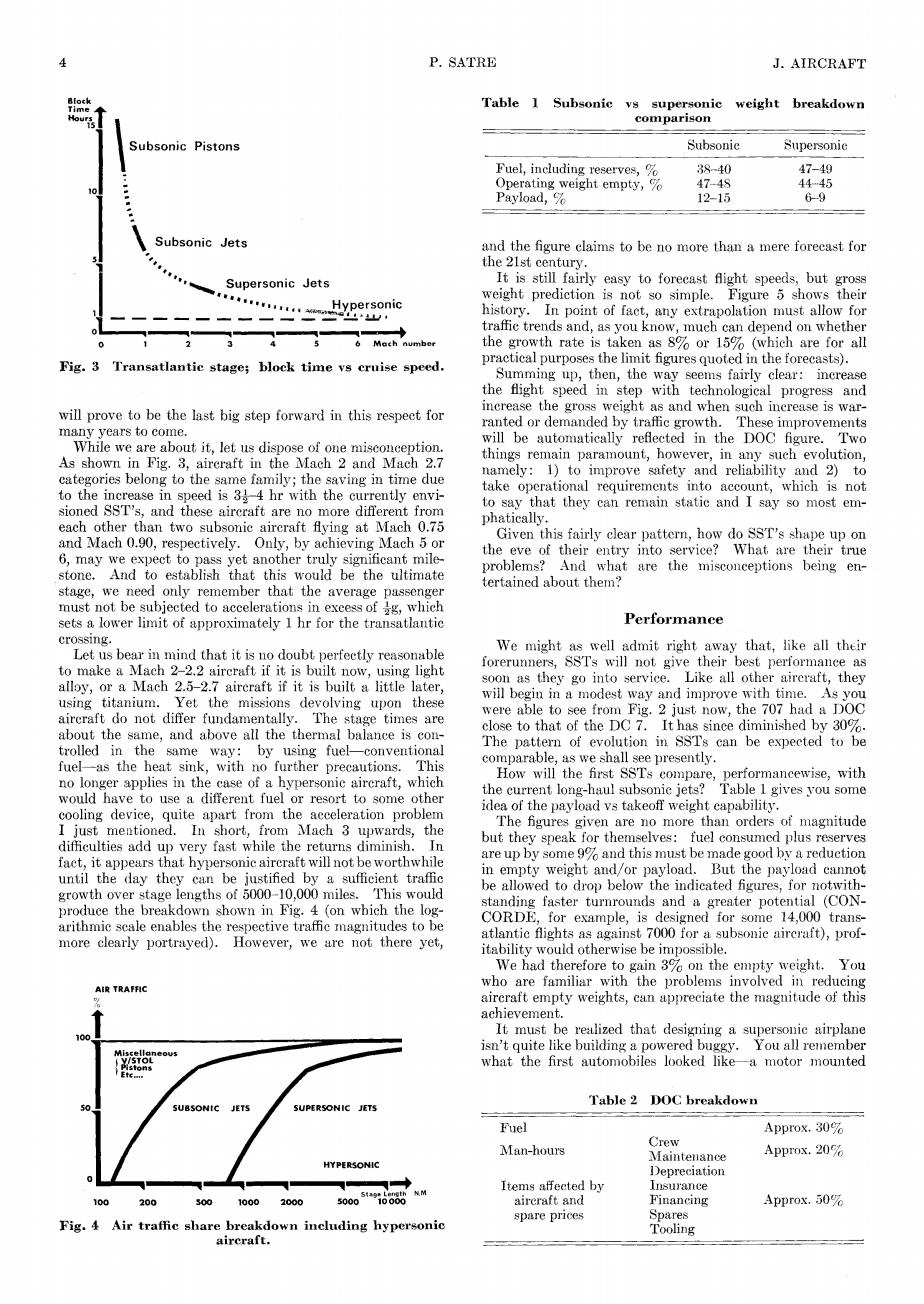
P.SATRE J.AIRCRAFT Table 1 Subsonic vs supersonic weight breakdown comparison Subsonic Pistons Subsonie Supersonic Fuel,including reserves, 38-40 47-49 Operating weight empty, 47-48 44-45 : Payload, 12-15 6-9 Subsonic Jets and the figure claims to be no more than a mere forecast for the 21st century Supersonic Jets It is still fairly easy to forecast flight speeds,but gross weight prediction is not so simple.Figure 5 shows their Hypersonic 01, history.In point of fact,any extrapolation must allow for 0 traffic trends and,as you know,much can depend on whether 0 6 Mach number the growth rate is taken as 8%or 15%(which are for all Fig.3 Transatlantie stage;block time vs cruise speed practical purposes the limit figures quoted in the forecasts). Summing up,then,the way seems fairly clear:increase the flight speed in step with technological progress and will prove to be the last big step forward in this respect for increase the gross weight as and when such inerease is war- ranted or demanded by traffic growth.These improvements many years to come. While we are about it,let us dispose of one misconception will be automatically reflected in the DOC figure.Two As shown in Fig.3,aireraft in the Mach 2 and Mach 2.7 things remain paramount,however,in any such evolution, namely:1)to improve safety and reliability and 2)to categories belong to the same family;the saving in time due take operational requirements into account,which is not to the increase in speed is 334 hr with the currently envi- sioned SST's,and these aircraft are no more different from to say that they can remain static and I say so most em- each other than two subsonic aircraft Aying at Mach 0.75 phatically. Given this fairly clear pattern,how do SST's shape up on and Mach 0.90,respectively.Only,by achieving Mach 5 or the eve of their entry into service?What are their true 6,may we expect to pass yet another truly significant mile- problems?And what are the misconceptions being en- stone.And to establish that this would be the ultimate tertained about them? stage,we need only remember that the average passenger must not be subjected to accelerations in excess of g,which sets a lower limit of approximately 1 hr for the transatlantic Performance crossing. Let us bear in mind that it is no doubt perfectly reasonable We might as well admit right away that,like all their to make a Mach 2-2.2 aircraft if it is built now,using light forerunners,SSTs will not give their best performance as alloy,or a Mach 2.5-2.7 aircraft if it is built a little later, soon as they go into service.Like all other aireraft,they using titanium.Yet the missions devolving upon these will begin in a modest way and improve with time.As you aireraft do not differ fundamentally.The stage times are were able to see from Fig.2 just now,the 707 had a DOC close to that of the DC 7.It has since diminished by 30%. about the same,and above all the thermal balance is con- trolled in the same way:by using fuel-conventional The pattern of evolution in SSTs can be expected to be fuel-as the heat sink,with no further precautions.This comparable,as we shall see presently. no longer applies in the case of a hypersonic aircraft,which How will the first SSTs compare,performancewise,with the current long-haul subsonic jets?Table I gives you some would have to use a different fuel or resort to some other idea of the payload vs takeoff weight eapability. cooling device,quite apart from the acceleration problem I just mentioned.In short,from Mach 3 upwards,the The figures given are no more than orders of magnitude difficulties add up very fast while the returns diminish.In but they speak for themselves:fuel consumed plus reserves fact,it appears that hypersonic aircraft will not be worthwhile are up by some 9%and this must be made good by a reduction until the day they can be justified by a sufficient traffic in empty weight and/or payload.But the payload cannot growth over stage lengths of 5000-10,000 miles.This would be allowed to drop below the indicated figures,for notwith- standing faster turnrounds and a greater potential (CON- produce the breakdown shown in Fig.4 (on which the log- CORDE,for example,is designed for some 14,000 trans- arithmic scale enables the respeetive traffic magnitudes to be more clearly portrayed).However,we are not there yet, atlantie flights as against 7000 for a subsonie aireraft),prof- itability would otherwise be impossible. We had therefore to gain 3%on the empty weight.You who are familiar with the problems involved in reducing AIR TRAFFIC aireraft empty weights,can appreciate the magnitude of this achievement. It must be realized that designing a supersonic airplane isn't quite like building a powered buggy. You all remember what the first automobiles looked like- -a motor mounted SUBSONIC JETS SUPERSONIC JETS Table 2 DOC breakdown Fuel Approx.30% Man-hours Crew HYPERSONIC Maintenance Approx.20% Depreciation Items affected by Insurance 100200 30010002000 50o05i688 aireraft and Financing Approx.50 Fig.4 Air traffic share breakdown including hypersonic spare prices Spares Tooling aireraft.P. SATRE J. AIRCRAFT Block Time . Hours I Table 1 Subsonic vs supersonic weight breakdown comparison Subsonic Pistons Subsonic Jets Supersonic Jets Hypersonic ^-LL'UL/' 0 12345 6 Mach number Fig. 3 Transatlantic stage; block time vs cruise speed. will prove to be the last big step forward in this respect for many years to come. While we are about it, let us dispose of one misconception. As shown in Fig. 3, aircraft in the Mach 2 and Mach 2.7 categories belong to the same family; the saving in time due to the increase in speed is 3^-4 hr with the currently envisioned SST's, and these aircraft are no more different from each other than two subsonic aircraft flying at Mach 0.75 and Mach 0.90, respectively. Only, by achieving Mach 5 or 6, may we expect to pass yet another truly significant milestone. And to establish that this would be the ultimate stage, we need only remember that the average passenger must not be subjected to accelerations in excess of ^g, which sets a lower limit of approximately 1 hr for the transatlantic crossing. Let us bear in mind that it is no doubt perfectly reasonable to make a Mach 2-2.2 aircraft if it is built now, using light alloy, or a Mach 2.5-2.7 aircraft if it is built a little later, using titanium. Yet the missions devolving upon these aircraft do not differ fundamentally. The stage times are about the same, and above all the thermal balance is controlled in the same way: by using fuel—conventional fuel—as the heat sink, with no further precautions. This no longer applies in the case of a hypersonic aircraft, which would have to use a different fuel or resort to some other cooling device, quite apart from the acceleration problem I just mentioned. In short, from Mach 3 upwards, the difficulties add up very fast while the returns diminish. In fact, it appears that hypersonic aircraft will not be worthwhile until the day they can be justified by a sufficient traffic growth over stage lengths of 5000-10,000 miles. This would produce the breakdown shown in Fig. 4 (on which the logarithmic scale enables the respective traffic magnitudes to be more clearly portrayed). However, we are not there yet, 200 Stage Length N.M 500O 100OO Subsonic Supersonic Fuel, including reserves, % Operating weight empty, % Payload, % 38-40 47-48 12-15 47-49 44-45 6-9 and the figure claims to be no more than a mere forecast for the 21st century. It is still fairly easy to forecast flight speeds, but gross weight prediction is not so simple. Figure 5 shows their history. In point of fact, any extrapolation must allow for traffic trends and, as you know, much can depend on whether the growth rate is taken as 8% or 15% (which are for all practical purposes the limit figures quoted in the forecasts). Summing up, then, the way seems fairly clear: increase the flight speed in step with technological progress and increase the gross weight as and when such increase is warranted or demanded by traffic growth. These improvements will be automatically reflected in the DOC figure. Two things remain paramount, however, in any such evolution, namely: 1) to improve safety and reliability and 2) to take operational requirements into account, which is not to say that they can remain static and I say so most emphatically. Given this fairly clear pattern, how do SST's shape up on the eve of their entry into service? What are their true problems? And what are the misconceptions being entertained about them? Performance We might as w r ell admit right away that, like all their forerunners, SSTs will not give their best performance as soon as they go into service. Like all other aircraft, they will begin in a modest way and improve with time. As you were able to see from Fig. 2 just now, the 707 had a DOC close to that of the DC 7. It has since diminished by 30%. The pattern of evolution in SSTs can be expected to be comparable, as we shall see presently. How will the first SSTs compare, performancewise, with the current long-haul subsonic jets? Table 1 gives you some idea of the payload vs takeoff weight capability. The figures given are no more than orders of magnitude but they speak for themselves: fuel consumed plus reserves are up by some 9% and this must be made good by a reduction in empty weight and/or payload. But the payload cannot be allowed to drop below the indicated figures, for notwithstanding faster turnrounds and a greater potential (CONCORDE, for example, is designed for some 14,000 transatlantic flights as against 7000 for a subsonic aircraft), profitability would otherwise be impossible. We had therefore to gain 3% on the empty weight. You who are familiar with the problems involved in reducing aircraft empty weights, can appreciate the magnitude of this achievement. It must be realized that designing a supersonic airplane isn't quite like building a powered buggy. You all remember what the first automobiles looked like—a motor mounted Table 2 DOC breakdown Fig. 4 Air traffic share breakdown including hypersonic aircraft. Fuel Man-hours Items affected by aircraft and spare prices Crew Maintenance Depreciation Insurance Financing Spares Tooling Approx. 30% Approx. 20% Approx. 50%