正在加载图片...
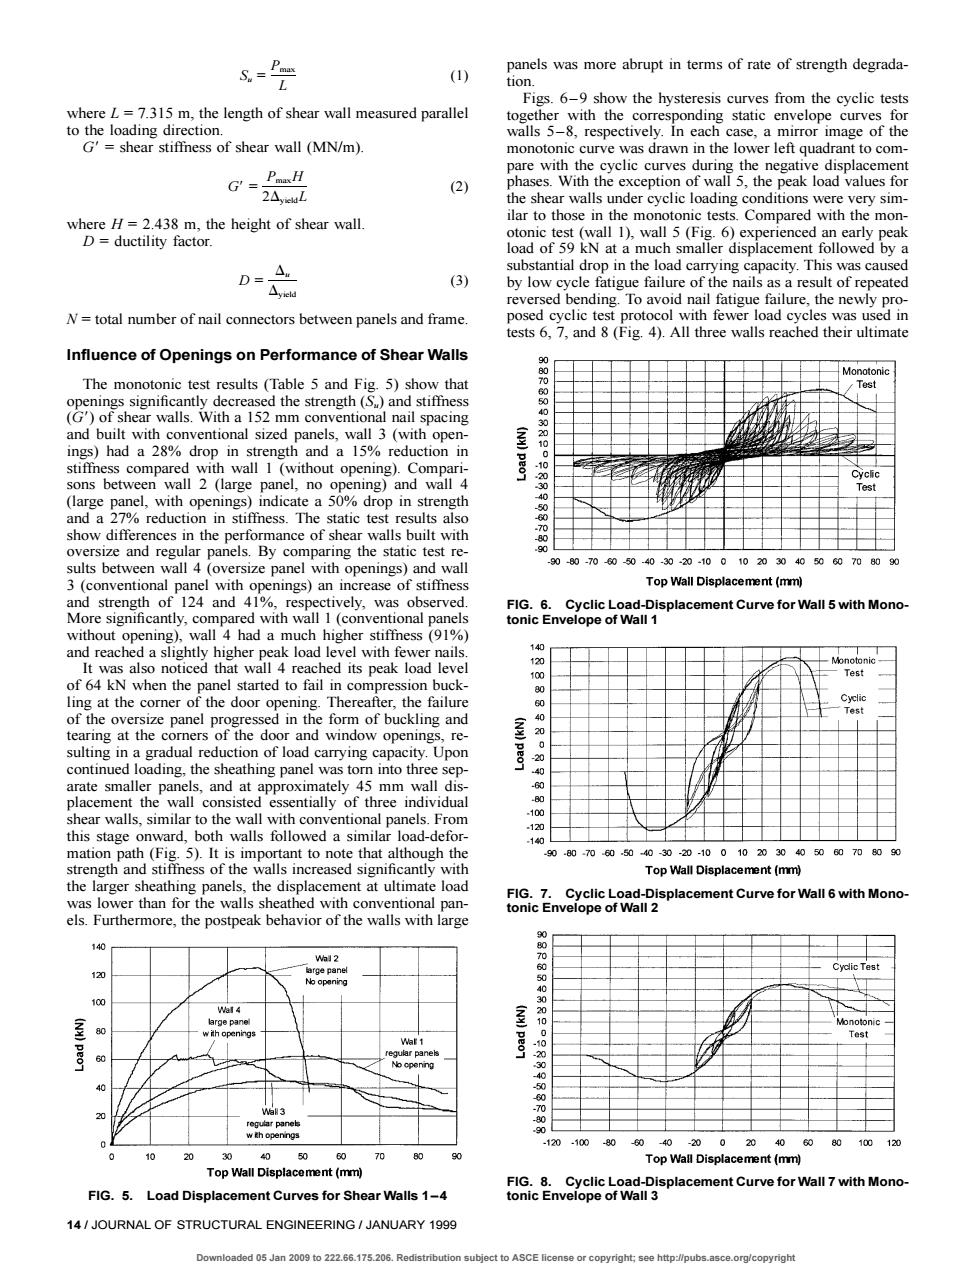
s.P () panelss more abrupt in tems of ate of egrada L=7.315 m,the length of shear wall measured paralle Figs.6-9 show the hysteresis curves from the cyclic tests ectively.n each a mirror image of品 fness of shear wall (MN/m) dis G=2,0 the shear s fo hrthe height of shear wall. ilar to those in ic test all D.wall 5 c Compared with the mor N at D= ated N=total number of nail connectors between panels and frame. (Fig4).All three walls reached their ultimate Influence of Openings on Performance of Shear Walls 水 wal wall n)had a 28% and a 15% on ir sons bet no ing) ing the stat test r )80600403020.100102030405007000 el with Top Wall Displacement (mm) with opening wall 4 had a much highe 55 (0 rea hed its pea .e ling at the comer of the nin Therea r,th orm of b e of load arate sma and at即 shear walls similar to the wall ath (Fg nt to tha although 70805时 3020.100102030405060700 the Top Wall Displacement (mm) the 120.1000-60 0 80100 Top V Top Wall Displacement (mm) ment (m FIG.5.Load Displacement Curves for Shear Walls 1-4 Curve for Wall 7with Mono 14/JOURNAL OF STRUCTURAL ENGINEERING/JANUARY 199 ded 05 Jan 2009 to 222.65.175.206.Rodistribution s to ASCE 14 / JOURNAL OF STRUCTURAL ENGINEERING / JANUARY 1999 FIG. 8. Cyclic Load-Displacement Curve for Wall 7 with Monotonic Envelope of Wall 3 FIG. 7. Cyclic Load-Displacement Curve for Wall 6 with Monotonic Envelope of Wall 2 FIG. 6. Cyclic Load-Displacement Curve for Wall 5 with Monotonic Envelope of Wall 1 FIG. 5. Load Displacement Curves for Shear Walls 1–4 Pmax Su = (1) L where L = 7.315 m, the length of shear wall measured parallel to the loading direction. G9 = shear stiffness of shear wall (MN/m). P H max G9 = (2) 2DyieldL where H = 2.438 m, the height of shear wall. D = ductility factor. Du D = (3) Dyield N = total number of nail connectors between panels and frame. Influence of Openings on Performance of Shear Walls The monotonic test results (Table 5 and Fig. 5) show that openings significantly decreased the strength (Su) and stiffness (G9) of shear walls. With a 152 mm conventional nail spacing and built with conventional sized panels, wall 3 (with openings) had a 28% drop in strength and a 15% reduction in stiffness compared with wall 1 (without opening). Comparisons between wall 2 (large panel, no opening) and wall 4 (large panel, with openings) indicate a 50% drop in strength and a 27% reduction in stiffness. The static test results also show differences in the performance of shear walls built with oversize and regular panels. By comparing the static test results between wall 4 (oversize panel with openings) and wall 3 (conventional panel with openings) an increase of stiffness and strength of 124 and 41%, respectively, was observed. More significantly, compared with wall 1 (conventional panels without opening), wall 4 had a much higher stiffness (91%) and reached a slightly higher peak load level with fewer nails. It was also noticed that wall 4 reached its peak load level of 64 kN when the panel started to fail in compression buckling at the corner of the door opening. Thereafter, the failure of the oversize panel progressed in the form of buckling and tearing at the corners of the door and window openings, resulting in a gradual reduction of load carrying capacity. Upon continued loading, the sheathing panel was torn into three separate smaller panels, and at approximately 45 mm wall displacement the wall consisted essentially of three individual shear walls, similar to the wall with conventional panels. From this stage onward, both walls followed a similar load-deformation path (Fig. 5). It is important to note that although the strength and stiffness of the walls increased significantly with the larger sheathing panels, the displacement at ultimate load was lower than for the walls sheathed with conventional panels. Furthermore, the postpeak behavior of the walls with large panels was more abrupt in terms of rate of strength degradation. Figs. 6–9 show the hysteresis curves from the cyclic tests together with the corresponding static envelope curves for walls 5–8, respectively. In each case, a mirror image of the monotonic curve was drawn in the lower left quadrant to compare with the cyclic curves during the negative displacement phases. With the exception of wall 5, the peak load values for the shear walls under cyclic loading conditions were very similar to those in the monotonic tests. Compared with the monotonic test (wall 1), wall 5 (Fig. 6) experienced an early peak load of 59 kN at a much smaller displacement followed by a substantial drop in the load carrying capacity. This was caused by low cycle fatigue failure of the nails as a result of repeated reversed bending. To avoid nail fatigue failure, the newly proposed cyclic test protocol with fewer load cycles was used in tests 6, 7, and 8 (Fig. 4). All three walls reached their ultimate Downloaded 05 Jan 2009 to 222.66.175.206. Redistribution subject to ASCE license or copyright; see http://pubs.asce.org/copyright