正在加载图片...
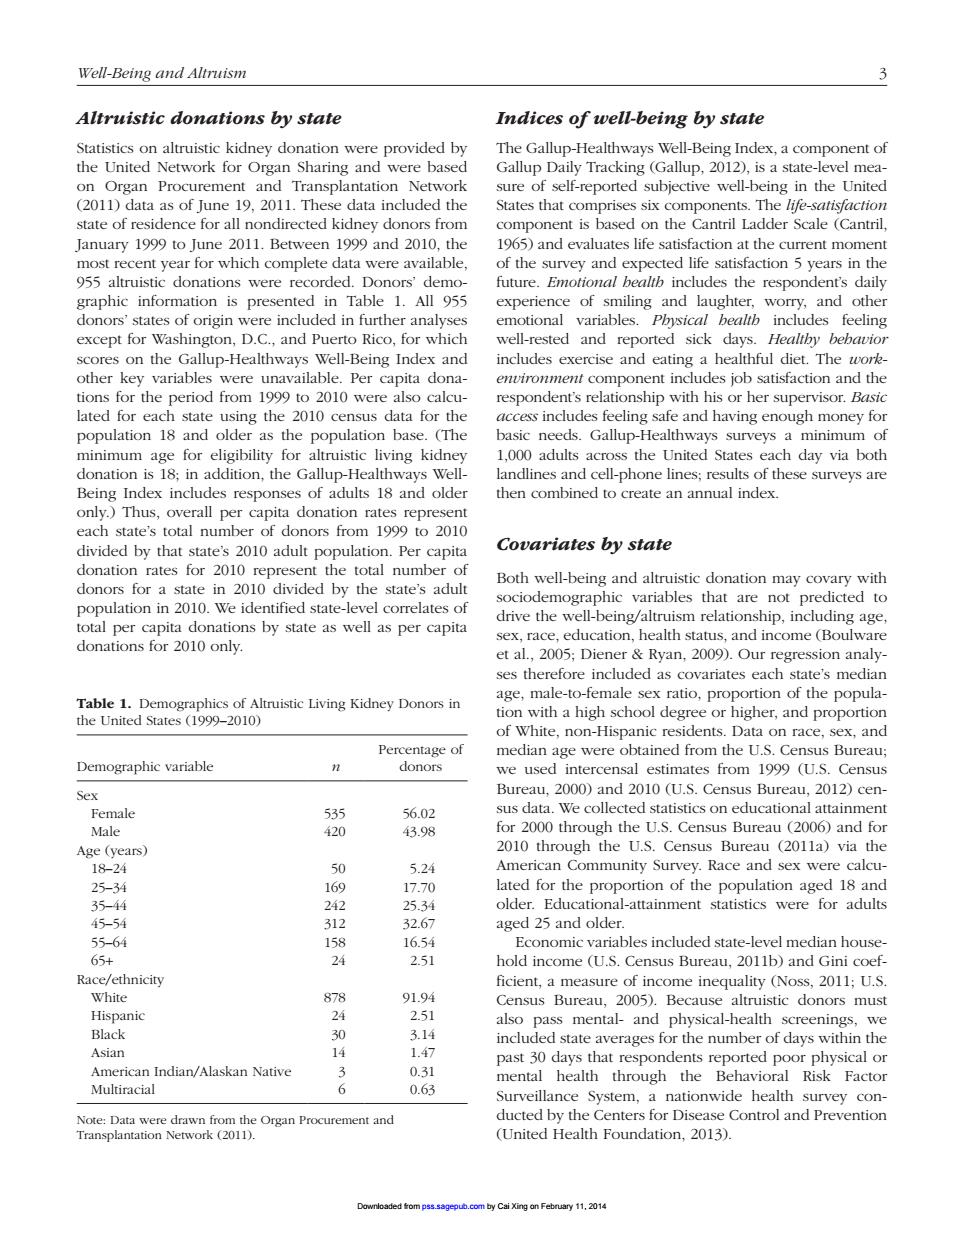
Well-Being and Altruism Altruistic donations by state Indices of well-being by state Sharing and were ba The Gallup-Heaing Index.a component of up,2012 (2011 data as of lune 19.2011.These data included the States that comprises six components.The life state of residence for all nondirected kidney donors from component is based on the Cantril Ladder Scale (Cantril which ded ere av action 5 years in experience of smiling and laughter.worry.and othe emotional variables.Physical bealtb includes feeling well-rested and reported sick days. and ea thful The t ondenr's relationshin with his or her sunervisor lated for each state using the 2010 census data for the access indudes feeling safe and having enough money for population 18 and older as the population base The basic needs.Gallup-Healthways surveys a minimum inimun living kidn 1,000 adult es each day via botl ombined to only.)Thus,overall per capita donation rates repr sent each state's total number of donors from 1999 to 2010 Covariates by state by that s for stare in 2010 divided b Both well-being and altruistic donation may covary with total per capita don alth sta 0)an ach state's media Table 1.D ents. e of White,non-Hispanic res Demographic variable donors se Bureau 2000)and 2010 (US Census Bureau 2012)cen 535 56.0m sus data.We collected statistics on educational attainmen 420 43.98 000 through urea Age (years) h lated for the proportion of the population aged 18 and 35-4 25.3 older.Educa l-attainment statistics were for adults 32 age d 25 and olde an hor 65+ 251 hold inc ne (s Census Bur eau 201b)and Gini coef Race/ethnicity ficient,a measure of income inequality (Noss,2011;U.S Census Bureau, 2005) Because Black nic altruistic donors must ealt 30 physical-h 3.1 pass mental-and Asian de d/n ve 436 t0 days mental health through the Behavioral Risk Factor Surveillance System,a nationwide health survey con Control and Prevention 11,201 Well-Being and Altruism 3 Altruistic donations by state Statistics on altruistic kidney donation were provided by the United Network for Organ Sharing and were based on Organ Procurement and Transplantation Network (2011) data as of June 19, 2011. These data included the state of residence for all nondirected kidney donors from January 1999 to June 2011. Between 1999 and 2010, the most recent year for which complete data were available, 955 altruistic donations were recorded. Donors’ demographic information is presented in Table 1. All 955 donors’ states of origin were included in further analyses except for Washington, D.C., and Puerto Rico, for which scores on the Gallup-Healthways Well-Being Index and other key variables were unavailable. Per capita donations for the period from 1999 to 2010 were also calculated for each state using the 2010 census data for the population 18 and older as the population base. (The minimum age for eligibility for altruistic living kidney donation is 18; in addition, the Gallup-Healthways WellBeing Index includes responses of adults 18 and older only.) Thus, overall per capita donation rates represent each state’s total number of donors from 1999 to 2010 divided by that state’s 2010 adult population. Per capita donation rates for 2010 represent the total number of donors for a state in 2010 divided by the state’s adult population in 2010. We identified state-level correlates of total per capita donations by state as well as per capita donations for 2010 only. Indices of well-being by state The Gallup-Healthways Well-Being Index, a component of Gallup Daily Tracking (Gallup, 2012), is a state-level measure of self-reported subjective well-being in the United States that comprises six components. The life-satisfaction component is based on the Cantril Ladder Scale (Cantril, 1965) and evaluates life satisfaction at the current moment of the survey and expected life satisfaction 5 years in the future. Emotional health includes the respondent’s daily experience of smiling and laughter, worry, and other emotional variables. Physical health includes feeling well-rested and reported sick days. Healthy behavior includes exercise and eating a healthful diet. The workenvironment component includes job satisfaction and the respondent’s relationship with his or her supervisor. Basic access includes feeling safe and having enough money for basic needs. Gallup-Healthways surveys a minimum of 1,000 adults across the United States each day via both landlines and cell-phone lines; results of these surveys are then combined to create an annual index. Covariates by state Both well-being and altruistic donation may covary with sociodemographic variables that are not predicted to drive the well-being/altruism relationship, including age, sex, race, education, health status, and income (Boulware et al., 2005; Diener & Ryan, 2009). Our regression analyses therefore included as covariates each state’s median age, male-to-female sex ratio, proportion of the population with a high school degree or higher, and proportion of White, non-Hispanic residents. Data on race, sex, and median age were obtained from the U.S. Census Bureau; we used intercensal estimates from 1999 (U.S. Census Bureau, 2000) and 2010 (U.S. Census Bureau, 2012) census data. We collected statistics on educational attainment for 2000 through the U.S. Census Bureau (2006) and for 2010 through the U.S. Census Bureau (2011a) via the American Community Survey. Race and sex were calculated for the proportion of the population aged 18 and older. Educational-attainment statistics were for adults aged 25 and older. Economic variables included state-level median household income (U.S. Census Bureau, 2011b) and Gini coefficient, a measure of income inequality (Noss, 2011; U.S. Census Bureau, 2005). Because altruistic donors must also pass mental- and physical-health screenings, we included state averages for the number of days within the past 30 days that respondents reported poor physical or mental health through the Behavioral Risk Factor Surveillance System, a nationwide health survey conducted by the Centers for Disease Control and Prevention (United Health Foundation, 2013). Table 1. Demographics of Altruistic Living Kidney Donors in the United States (1999–2010) Demographic variable n Percentage of donors Sex Female 535 56.02 Male 420 43.98 Age (years) 18–24 50 5.24 25–34 169 17.70 35–44 242 25.34 45–54 312 32.67 55–64 158 16.54 65+ 24 2.51 Race/ethnicity White 878 91.94 Hispanic 24 2.51 Black 30 3.14 Asian 14 1.47 American Indian/Alaskan Native 3 0.31 Multiracial 6 0.63 Note: Data were drawn from the Organ Procurement and Transplantation Network (2011). Downloaded from pss.sagepub.com by Cai Xing on February 11, 2014