正在加载图片...
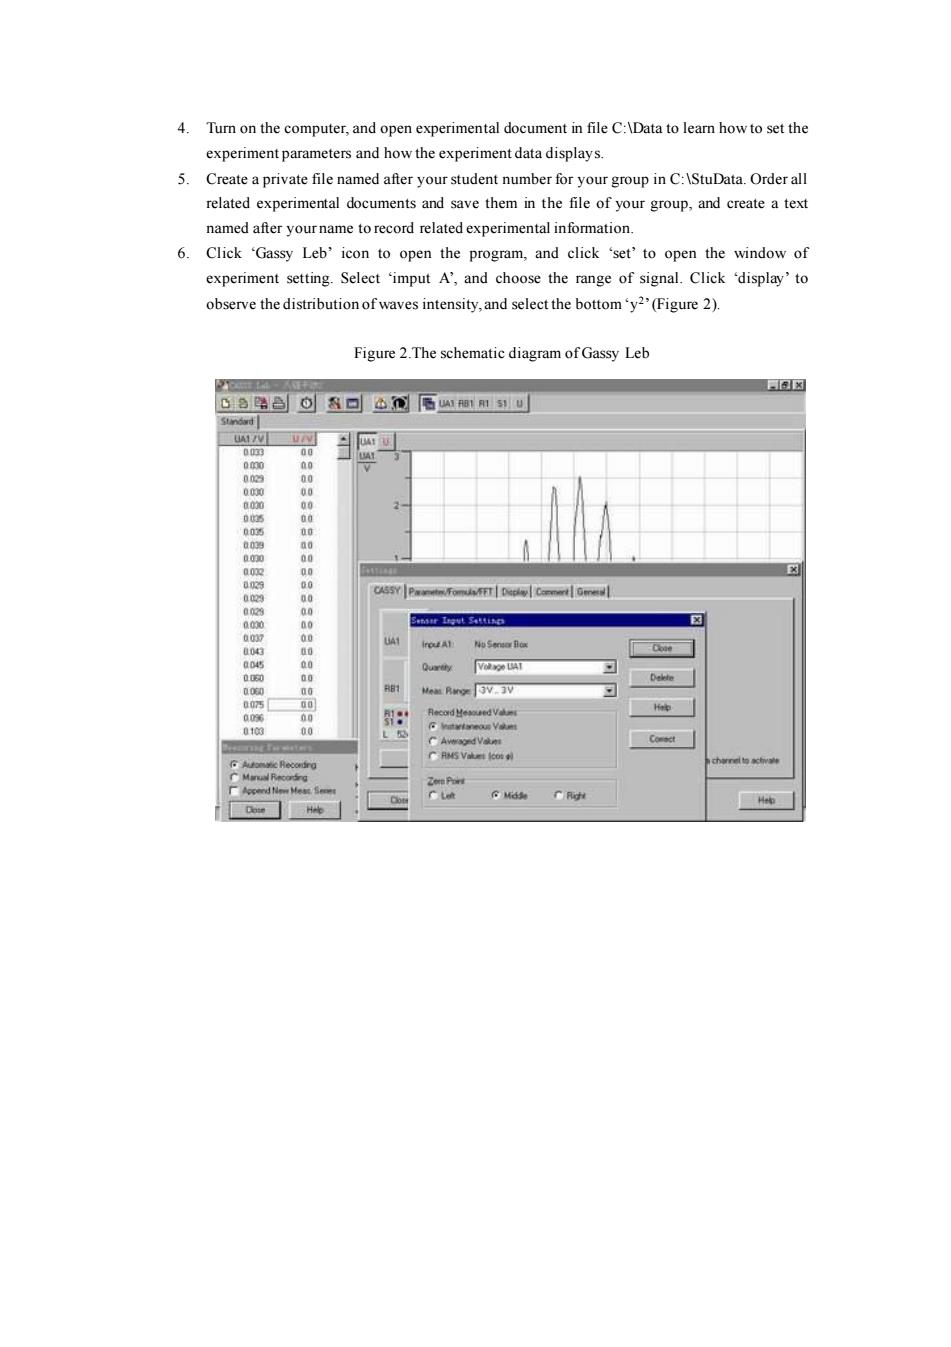
4.Turn on the computer,and open experimental document in file C:\Data to learn how to set the experiment parameters and how the experiment data displays. 5 Create a private file named after your student number for your group in C:\StuData.Order all related experimental documents and save them in the file of your group,and create a text named after your name to record related experimental information. 6.Click 'Gassy Leb'icon to open the program,and click 'set'to open the window of experiment setting.Select 'imput A',and choose the range of signal.Click 'display'to observe the distribution of waves intensity,and select the bottom'y2'(Figure 2). Figure 2.The schematic diagram of Gassy Leb 0S路凸⊙回仓)届11刚su Stndad UAI/V 0g0 00 08 00 00的0 a 003g 8 0029 00 8 CASSYP FomFTDplCom 0030 043 ao Quartty VoRage LiAT 00 Heat Range3V.3V 00% 00 010 00 L CAvsed Vaet ZomPort C 464. Turn on the computer, and open experimental document in file C:\Data to learn how to set the experiment parameters and how the experiment data displays. 5. Create a private file named after your student number for your group in C:\StuData. Order all related experimental documents and save them in the file of your group, and create a text named after your name to record related experimental information. 6. Click ‘Gassy Leb’ icon to open the program, and click ‘set’ to open the window of experiment setting. Select ‘imput A’, and choose the range of signal. Click ‘display’ to observe the distribution of waves intensity, and select the bottom ‘y 2 ’(Figure 2). Figure 2.The schematic diagram of Gassy Leb