正在加载图片...
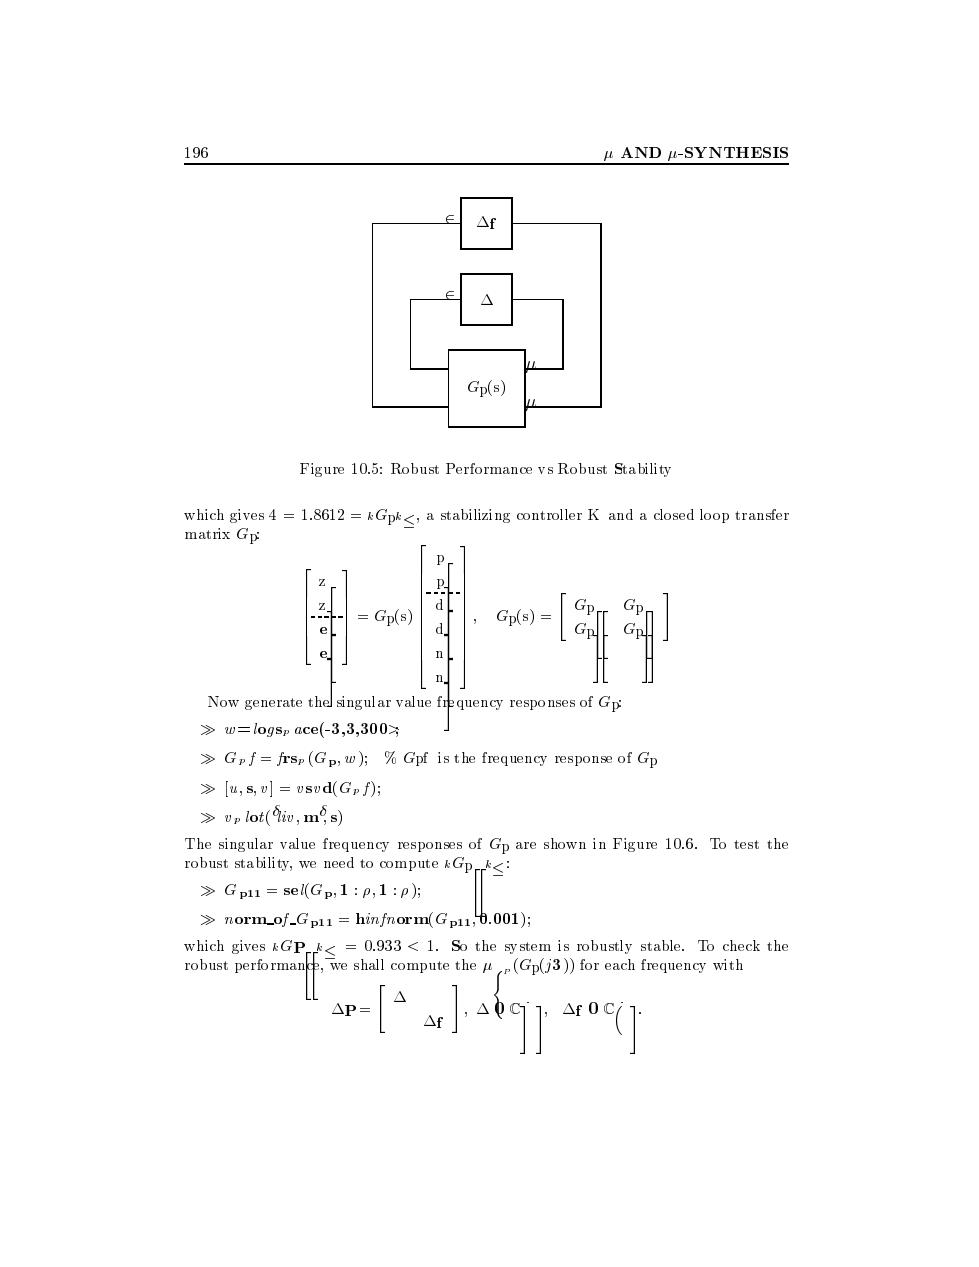
196 AND U-SYNTHESIS △f △ Gp(s) Figure 10.5:Robust Performance vs Robust Stability which gives 4 =1.8612 =&Gpk<,a stabilizing controller K and a closed loop transfer matrix Gp p Gp(s) 0 Now generate thel singular value frequency responses of Gp >w=logsp ace(-3,3,300 >Grf=frsp (Gp,w);Gpf is the frequency response of Gp >[u,s,v]vsvd(Gpf); ≥p lot(a,ms) The singular value frequency responses of Gp are shown in Figure 10.6.To test the robust stability,we need to compute &Gp: >Gp11 sel(Gp:1 p,1 p); >norm_of_Gp11 hinfnorm(Gp11,0.001); which gives &GP=0.933<1.So the system is robustly stable.To check the robust performan e,we shall compute the (Gp(j3))for each frequency with ravoh
AND SYNTHESIS f Gps Figure Robust Performance vs Robust Stability which gives
kGpk a stabilizing controller K and a closed loop transfer matrix Gp z z e e Gps p p d d n n Gps Gp Gp Gp Gp Now generate the singular value frequency responses of Gp wlogspace
Gpf frspGp w
Gpf is the frequency response of Gp u s v vsvdGpf vplot liv m s The singular value frequency responses of Gp are shown in Figure
To test the robust stability we need to compute kGpk Gp selGp norm of Gp hinfnormGp which gives kGP k So the system is robustly stable To check the robust performance we shall compute the P Gpj
for each frequency with P f C f C �������������������������������������������������������