正在加载图片...
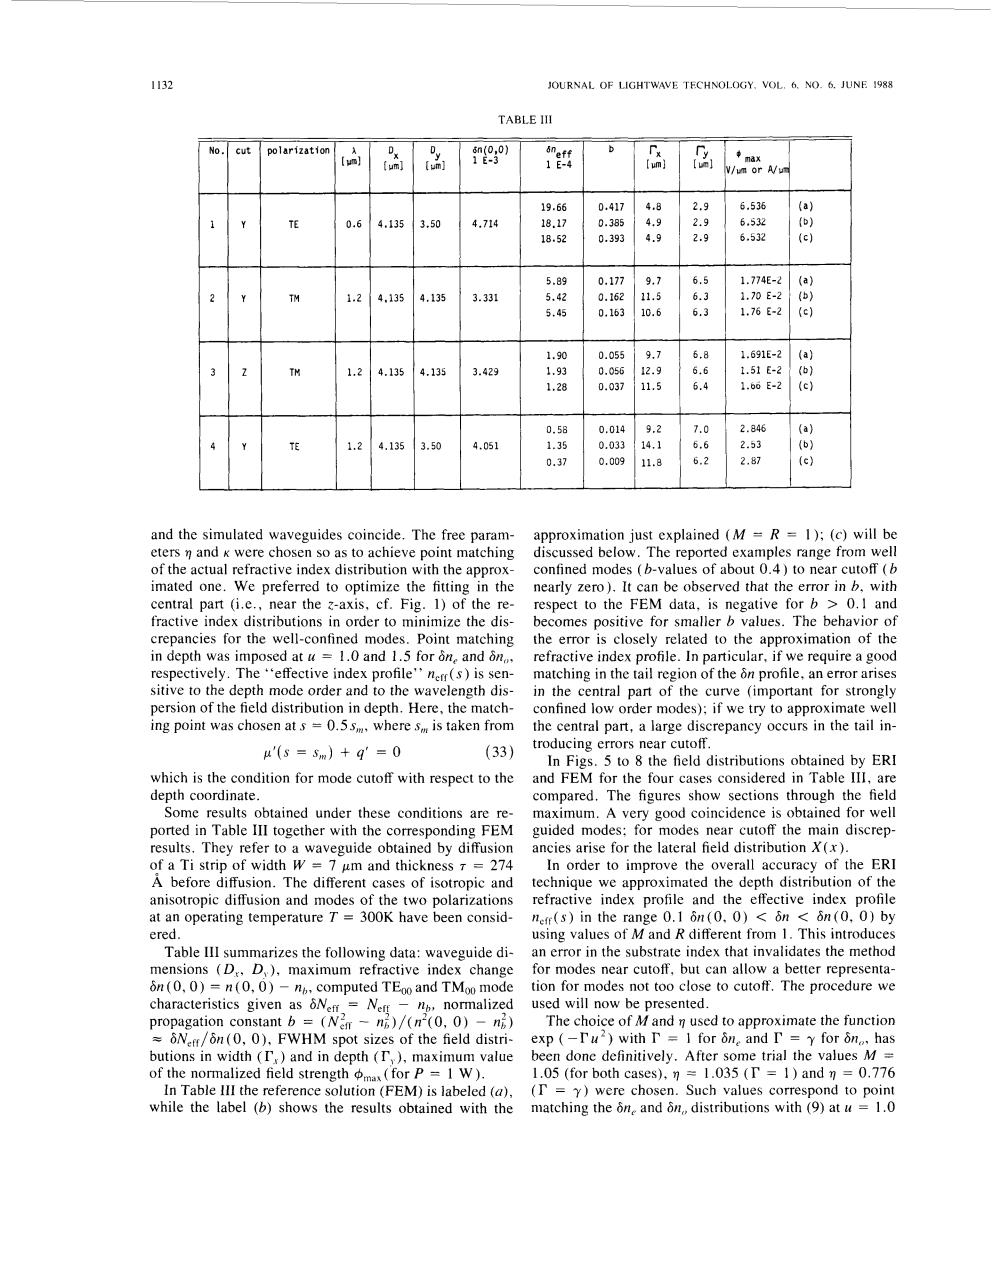
1132 JOURNAL OF LIGHTWAVE TECHNOLOGY.VOL,6.NO.6.JUNE 1988 TABLE III No.I cut polarization : (um] md V/un or A/un 19.66 0.417 4.8 2.9 6,536 (a) 0.6 4.135 3.50 4.714 18.17 0.385 4.9 2.9 6.532 ) 18.52 0.393 4.9 2.9 6.532 (c) 5.89 0.177 9.7 6.5 1.774E-2 (a) 多 1.2 4.135 4.135 3.331 5.42 0.162 11.5 6.3 1.70E-2 (b) 5.45 0.163 10.6 6.3 1.76E-2 (c) 1.90 0.055 9.7 6.8 1.691E-2 (a) 3 TH 1.2 4.135 4.135 3.429 1.93 0.056 12.9 6.6 1.51e-2 (b】 1.28 0.037 11.5 6.4 1.60E-2 (c) 0.58 0.014 9.2 7.0 2.846 (a) 1.2 4.135 3.50 4.051 1.35 0.033 14.1 6.6 2.53 (b) 0.37 0.009 11.8 6.2 2.87 (c) and the simulated waveguides coincide.The free param- approximation just explained (M =R 1);(c)will be eters n and k were chosen so as to achieve point matching discussed below.The reported examples range from well of the actual refractive index distribution with the approx- confined modes (b-values of about 0.4)to near cutoff (b imated one.We preferred to optimize the fitting in the nearly zero )It can be observed that the error in b.with central part (i.e.,near the z-axis,cf.Fig.1)of the re- respect to the FEM data,is negative for b>0.1 and fractive index distributions in order to minimize the dis- becomes positive for smaller b values.The behavior of crepancies for the well-confined modes.Point matching the error is closely related to the approximation of the in depth was imposed at u=1.0 and 1.5 for one and on. refractive index profile.In particular,if we require a good respectively.The "effective index profile''n(s)is sen- matching in the tail region of the on profile,an error arises sitive to the depth mode order and to the wavelength dis- in the central part of the curve (important for strongly persion of the field distribution in depth.Here,the match- confined low order modes);if we try to approximate well ing point was chosen at s =0.5sm,where s is taken from the central part,a large discrepancy occurs in the tail in- u'(s=Sm)+q=0 (33) troducing errors near cutoff. In Figs.5 to 8 the field distributions obtained by ERI which is the condition for mode cutoff with respect to the and FEM for the four cases considered in Table III,are depth coordinate. compared.The figures show sections through the field Some results obtained under these conditions are re- maximum.A very good coincidence is obtained for well ported in Table III together with the corresponding FEM guided modes;for modes near cutoff the main discrep- results.They refer to a waveguide obtained by diffusion ancies arise for the lateral field distribution X(x). of a Ti strip of width W=7 um and thickness 7 =274 In order to improve the overall accuracy of the ERI A before diffusion.The different cases of isotropic and technique we approximated the depth distribution of the anisotropic diffusion and modes of the two polarizations refractive index profile and the effective index profile at an operating temperature T 300K have been consid- nerr(s)in the range 0.1 6n(0.0)<on 6n(0.0)by ered. using values of M and R different from 1.This introduces Table III summarizes the following data:waveguide di- an error in the substrate index that invalidates the method mensions (D.,D )maximum refractive index change for modes near cutoff,but can allow a better representa- 6n(0,0)=n(0,0)-n,computed TEoo and TMoo mode tion for modes not too close to cutoff.The procedure we characteristics given as 6Nem=Nen-np,normalized used will now be presented. propagation constant b =(Ne-n)(n(0,0)-n) The choice of M and n used to approximate the function 6Nett/on(0,0).FWHM spot sizes of the field distri-exp (-Tu2)with r =I for one and I =Y for 6n.has butions in width (I)and in depth (I )maximum value been done definitively.After some trial the values M= of the normalized field strength max for P =1 W). 1.05 (for both cases),n 1.035 (T 1)andn 0.776 In Table III the reference solution (FEM)is labeled (a),(T =Y)were chosen.Such values correspond to point while the label (b)shows the results obtained with the matching the one and on,distributions with(9)at u=1.01132 JOURNAL OF LIGHTWAVE TECHNOLOGY. VOL. 6. NO. 6. JUNE 1988 and the simulated waveguides coincide. The free parameters r and K were chosen so as to achieve point matching of the actual refractive index distribution with the approximated one. We preferred to optimize the fitting in the central part (i.e., near the z-axis, cf. Fig. 1) of the refractive index distributions in order to minimize the discrepancies for the well-confined modes. Point matching in depth was imposed at U = 1 .O and 1.5 for An, and 6n,, respectively. The “effective index profile” nerf( s) is sensitive to the depth mode order and to the wavelength dispersion of the field distribution in depth. Here, the matching point was chosen at s = 0.5s,,,, where s, is taken from p’(s = s,,,) + q’ = 0 (33) which is the condition for mode cutoff with respect to the depth coordinate. Some results obtained under these conditions are reported in Table 111 together with the corresponding FEM results. They refer to a waveguide obtained by diffusion o! a Ti strip of width W = 7 pm and thickness 7 = 274 A before diffusion. The different cases of isotropic and anisotropic diffusion and modes of the two polarizations at an operating temperature T = 300K have been considered. Table I11 summarizes the following data: waveguide dimensions (Dr, D, ), maximum refractive index change 6n (0,O) = n (0,O) - nh, computed TE,, and TMoo mode characteristics given as &Ne, = Ne‘!, - n6, normalized propagation constant b = (Nzff - n,;)/(n2(0, 0) - n;) = 6Neff/6n (0, O), FWHM spot sizes of the field distributions in width (r,) and in depth (r, ), maximum value of the normalized field strength +,,, ( for P = 1 W ). In Table 111 the reference solution (FEM) is labeled (a), while the label (b) shows the results obtained with the approximation just explained (M = R = 1 ); (c) will be discussed below. The reported examples range from well confined modes (b-values of about 0.4) to near cutoff (b nearly zero). It can be observed that the error in b, with respect to the FEM data, is negative for b > 0.1 and becomes positive for smaller b values. The behavior of the error is closely related to the approximation of the refractive index profile. In particular, if we require a good matching in the tail region of the 6n profile, an error arises in the central part of the curve (important for strongly confined low order modes); if we try to approximate well the central part, a large discrepancy occurs in the tail introducing errors near cutoff. In Figs. 5 to 8 the field distributions obtained by ER1 and FEM for the four cases considered in Table 111, are compared. The figures show sections through the field maximum. A very good coincidence is obtained for well guided modes; for modes near cutoff the main discrepancies arise for the lateral field distribution X(x). In order to improve the overall accuracy of the ER1 technique we approximated the depth distribution of the refractive index profile and the effective index profile neff(s) in the range 0.1 6n(0, 0) < Sn < 6rz(0, 0) by using values of M and R different from 1. This introduces an error in the substrate index that invalidates the method for modes near cutoff, but can allow a better representation for modes not too close to cutoff. The procedure we used will now be presented. The choice of M and q used to approximate the function exp ( -Tu2) with l7 = 1 for Sn, and r = y for An,,, has been done definitively. After some trial the values M = 1.05 (for both cases), 7 = 1.035 (r = 1 ) and 77 = 0.776 (I? = y) were chosen. Such values correspond to point matching the 6n, and 6n,, distributions with (9) at U = 1 .O