正在加载图片...
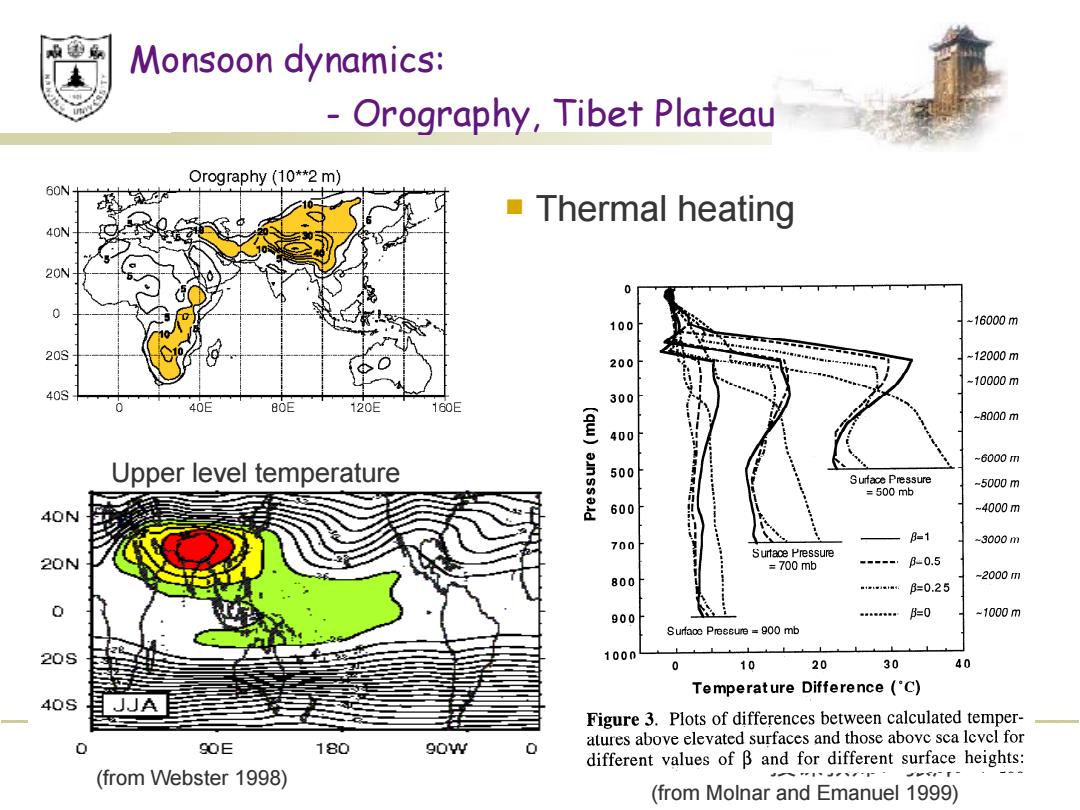
Monsoon dynamics: Orography,Tibet Plateau Orography (10**2 m) 60N Thermal heating 40N 20N 0 100 -16000m 20S 200 -12000m -10000m 40S 300 40E 80E 120E 160E -8000m 400 -6000m Upper level temperature (qu)anssald 500 Surface Pressure -5000m =500mb 600 -4000m B=1 700 -3000m Surtace Pressure 20N =700mb p-0.5 800 -2000m =0.25 900 e。=0 -1000m Surfaoe Preeeure =900 mb 20S 100n 0 10 20 30 40 Temperature Difference ('C) 40S Figure 3.Plots of differences between calculated temper- 90E 180 9ow O atures above elevated surfaces and those above sca lcvel for different values of B and for different surface heights: (from Webster 1998) (from Molnar and Emanuel 1999)授课教师:张洋 10 Monsoon dynamics: - Orography, Tibet Plateau cross-equatorial flux of the Findlater Jet [Findlater, 1969b]. The remainder of the mass flux is associated with the rotational part of the wind field. Thus the mass flux associated with the Somalia Current in the ocean and the total mass flux of the atmospheric Findlater Jet are roughly equivalent. In the boreal summer the divergent longitudinal flow of the Walker Circulation is about half as large as either of the monsoon components. However, during the boreal winter the divergent mass flux of the Walker Circulation is of a comparable magnitude. Throughout the annual cycle the SST in the Indian Ocean undergoes an interesting progression. Figure 10 shows three longitude-time sections across the Indian Ocean for the year 1992. In the most general sense the SST maxima should lag behind the annual cycle of solar heating by about 2 months. However, a closer scrutiny of Figure 10 shows that this is not the case. The northern Indian Ocean (Figure 10a) remains warm throughout most of the winter, slowly increasing to a maximum of 30C in late June. Substantial cooling occurs in the vicinity of Somalia commencing in June at the equator and during July in the Arabian Sea. The cooling is associated with both upwelling and evaporation accompanying the freshening winds of the southwest monsoon [Knox, 1987]. The southern Indian Ocean appears to undergo a more regular annual cycle. However, the SST maximum occurs some 5 months after the southern hemisphere summer solstice. Furthermore, the maximum SST in the boreal winter actually occurs even farther south near 15S in the vicinity of 60E, where, during February, temperatures exceed 30C. However, during this season and at these longitudes, maximum convection occurs equatorward of the maximum SST because of dynamical constraints [e.g., Walliser and Somerville, 1994; Tomas and Webster, 1997]. Figure 11a displays the major orographic features of the eastern hemisphere. The Indian Ocean is bordered to the west by the East African Highlands and to the north by the Himalayas and the Tibetan Figure 11a.(a) Orography and the south Asian summer monsoon. Orographic structure of the eastern hemisphere (units are 102 m). The Indian Ocean is surrounded by the East African Highlands to the west and the Himalayan Mountains to the north. Australia, on the other hand, is devoid of major orography. Orography with elevations >1 km are shaded. . n Thermal heating 2. Description of the Monsoons Ramage [1971] provided a rather strict definition of a monsoon and identified the African, Asian, and Australian regions as satisfying both a wind reversal and seasonal precipitation criterion. However, the Americas qualify as monsoon regions at least in terms of precipitation. In the following sections the various monsoon circulations will be described. 2.1. The Annual Cycle of the Monsoon In Figure 6a the horizontal distribution of the 200-500--mbar layer mean temperature is plotted for boreal summer (Figure 6a left) and winter (Figure 6a right). The shaded region shows a mean temperature warmer than --26C. During summer a planetary-scale warm air mass is centered on south Asia with the maximum average layer temperature ( > --22C) over the southern Tibetan Plateau, resulting in strong temperature gradients in both the north-south and east-west directions. A warm temperature ridge exists over the North American continent, and a deep temperature trough stretches from the west coast of North America to the central Pacific. A similar trough lies over the Atlantic Ocean. The upper tropospheric flow pattern during summer identifies clearly the thermal contrast between continents and oceans [e.g., Krishnamurti, 1971a, b]. The boreal winter presents a very different structure. A much smaller section of the globe (northeast of Australia) is warmer than --26C. A Back to the previous section Forward to the next section Figure 6a. Mean upper tropospheric (200--500 mbar) temperature (degrees Celsius) for the boreal summer (JJA), and boreal winter (DJF), averaged between 1979 and 1992. The boreal summer plot is based on calculations first made by Li and Yanai [1996]. Mean columnar temperatures warmer than --25C are shaded. Upper level temperature (from Webster 1998) (from Molnar and Emanuel 1999)