正在加载图片...
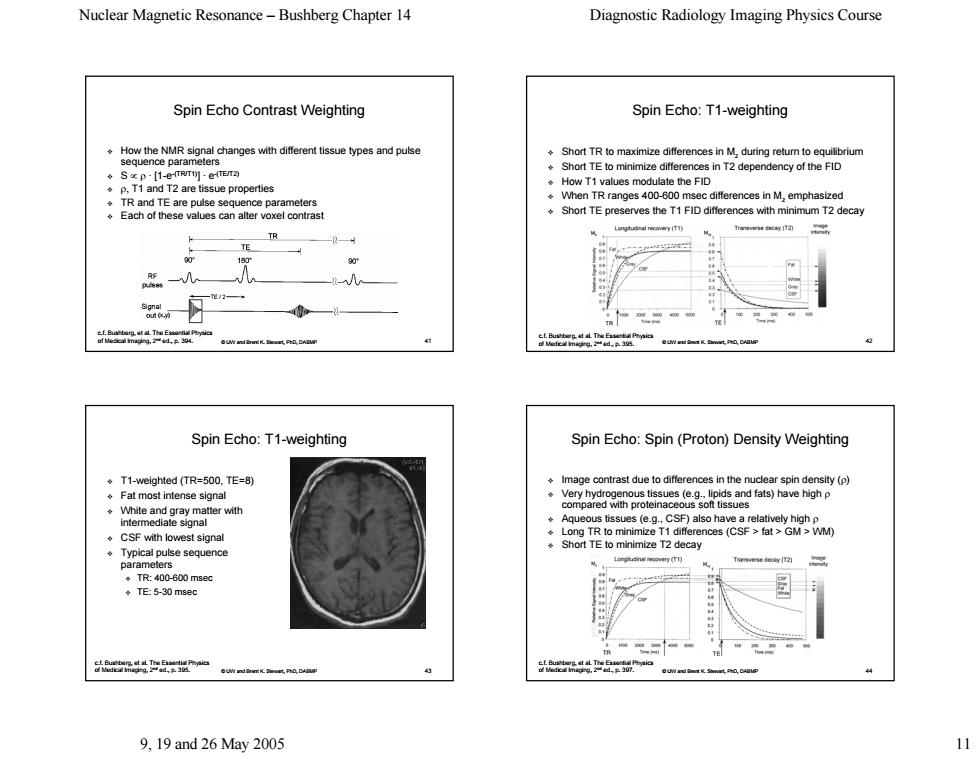
Nuclear Magnetic Resonance-Bushberg Chapter 14 Diagnostic Radiology Imaging Physics Course Spin Echo Contrast Weighting Spin Echo:T1-weighting HowthNMRhanges withrissue types and pulse Short TR to maximize differences in M,during retum to equilibrium Short TE to minimize differences in T2 dependency of the FID How T1 values modulate the FID ssue properties TR and TE are pulse sequence parameters ◆Vhen TR ranges400-6o differences in M,emphasized Each of these values can alter voxel contrast Short TE preserves the T1 FID differences with minimum T2 decay R 90 4a 41 Spin Echo:T1-weighting Spin Echo:Spin(Proton)Density Weighting .T1-weighted(TR=500.TE=8) Image contrast due to differences in the nuclear spin density(p) Fat most intense signal gmparego38mowstsuegeasoosaed and fats)have highp White and gray matter with intemmediate signal Aqueous tissues (e.g.,CSF)also have a relatively high p .CSF with lowest signal Long TR to minimize T1 differ nces (CSF fat GM>WM) pulse sequence Short TE to minimize T2 decay ◆TR:400-600mse ◆TE5-30msec 盟 9.19and26May2005Nuclear Magnetic Resonance – Bushberg Chapter 14 Diagnostic Radiology Imaging Physics Course 9, 19 and 26 May 2005 11 © UW and Brent K. Stewart, PhD, DABMP 41 Spin Echo Contrast Weighting How the NMR signal changes with different tissue types and pulse sequence parameters S ∝ ρ · [1-e-(TR/T1)] · e-(TE/T2) ρ, T1 and T2 are tissue properties TR and TE are pulse sequence parameters Each of these values can alter voxel contrast Each of these values can alter voxel contrast c.f. Bushberg, et al. The Essential Physics of Medical Imaging, 2nd ed., p. 394. (x,y) © UW and Brent K. Stewart, PhD, DABMP 42 Spin Echo: T1-weighting Short TR Short TR to maximize di to maximize differences in Mz during return to equilibrium Short TE to minimize differences in T2 dependency of the FID How T1 values modulate the FID When TR ranges 400-600 msec differences in Mz emphasized Short TE preserves the T1 FID differences with minimum T2 decay c.f. Bushberg, et al. The Essential Physics of Medical Imaging, 2nd ed., p. 395. © UW and Brent K. Stewart, PhD, DABMP 43 Spin Echo: T1-weighting T1-weighted (TR=500, TE=8) weighted (TR=500, TE=8) Fat most intense signal Fat most intense signal White and gray matter with White and gray matter with intermediate signal intermediate signal CSF with lowest signal CSF with lowest signal Typical pulse sequence Typical pulse sequence parameters TR: 400-600 msec TE: 5-30 msec c.f. Bushberg, et al. The Essential Physics of Medical Imaging, 2nd ed., p. 395. T1 (TR=549, TE=11) © UW and Brent K. Stewart, PhD, DABMP 44 Spin Echo: Spin (Proton) Density Weighting Image contrast due to differences in the nuclear spin density ( Image contrast due to differences in the nuclear spin density (ρ) Very hydrogenous tissues (e.g., lipids and fats) have high Very hydrogenous tissues (e.g., lipids and fats) have high ρ compared with proteinaceous soft tissues Aqueous tissues (e.g., CSF) also have a relatively high Aqueous tissues (e.g., CSF) also have a relatively high ρ Long TR to minimize T1 differences (CSF > fat > GM > WM) (CSF > fat > GM > WM) Short TE to minimize T2 decay c.f. Bushberg, et al. The Essential Physics of Medical Imaging, 2nd ed., p. 397