正在加载图片...
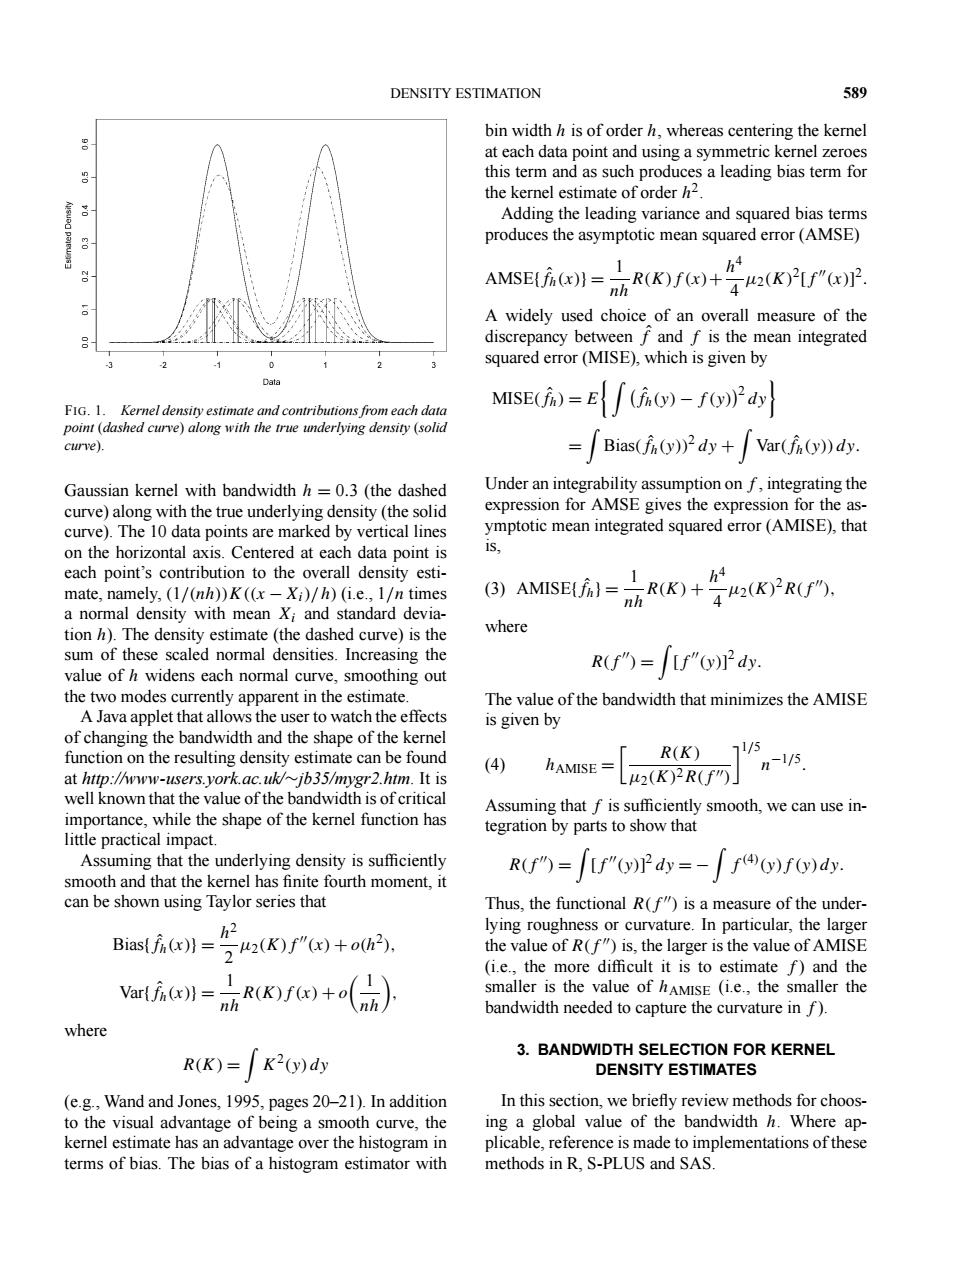
DENSITY ESTIMATION 589 bin width h is of order h,whereas centering the kernel at each data point and using a symmetric kernel zeroes this term and as such produces a leading bias term for the kernel estimate of order h2. Adding the leading variance and squared bias terms produces the asymptotic mean squared error(AMSE) AMSE)(KF A widely used choice of an overall measure of the discrepancy between f and f is the mean integrated squared error(MISE),which is given by Data FIG.1.Kernel density estimate and contributions from each data MsEi)=E∫ao)-joPd point (dashed curve)along with the true underlying density (solid curve). =Bias(fy))2dy+Var(f(y))dy. Gaussian kernel with bandwidth h=0.3 (the dashed Under an integrability assumption on f,integrating the curve)along with the true underlying density(the solid expression for AMSE gives the expression for the as- curve).The 10 data points are marked by vertical lines ymptotic mean integrated squared error(AMISE),that on the horizontal axis.Centered at each data point is 1s, each point's contribution to the overall density esti- mate,namely,(1/(nh))K((x-Xi)/h)(i.e.,1/n times 同)AMEE=RuK+答FR. h4 a normal density with mean Xi and standard devia- tion h).The density estimate (the dashed curve)is the where sum of these scaled normal densities.Increasing the value of h widens each normal curve,smoothing out R(f")=[f")dy the two modes currently apparent in the estimate. The value of the bandwidth that minimizes the AMISE A Java applet that allows the user to watch the effects is given by of changing the bandwidth and the shape of the kernel 1/ function on the resulting density estimate can be found R(K) (4) hAMISE L2(K)2R(f」 n-l/5 at http://www-users.york.ac.uk/~jb35/mygr2.htm.It is well known that the value of the bandwidth is of critical Assuming that f is sufficiently smooth,we can use in- importance,while the shape of the kernel function has tegration by parts to show that little practical impact. Assuming that the underlying density is sufficiently R(f")=[f"()P dy=-f))f)dy. smooth and that the kernel has finite fourth moment,it can be shown using Taylor series that Thus,the functional R(f")is a measure of the under- h2 lying roughness or curvature.In particular,the larger Bias(K)") the value of R(f")is,the larger is the value of AMISE (i.e.,the more difficult it is to estimate f)and the Vartjin()=R(K))+o smaller is the value of hAMISE (i.e.,the smaller the nh nh bandwidth needed to capture the curvature in f). where 3.BANDWIDTH SELECTION FOR KERNEL R(K)=K2)dy DENSITY ESTIMATES (e.g.,Wand and Jones,1995,pages 20-21).In addition In this section,we briefly review methods for choos- to the visual advantage of being a smooth curve,the ing a global value of the bandwidth h.Where ap- kernel estimate has an advantage over the histogram in plicable,reference is made to implementations of these terms of bias.The bias of a histogram estimator with methods in R.S-PLUS and SAS.DENSITY ESTIMATION 589 FIG. 1. Kernel density estimate and contributions from each data point (dashed curve) along with the true underlying density (solid curve). Gaussian kernel with bandwidth h = 0.3 (the dashed curve) along with the true underlying density (the solid curve). The 10 data points are marked by vertical lines on the horizontal axis. Centered at each data point is each point’s contribution to the overall density estimate, namely, (1/(nh))K((x −Xi)/h) (i.e., 1/n times a normal density with mean Xi and standard deviation h). The density estimate (the dashed curve) is the sum of these scaled normal densities. Increasing the value of h widens each normal curve, smoothing out the two modes currently apparent in the estimate. A Java applet that allows the user to watch the effects of changing the bandwidth and the shape of the kernel function on the resulting density estimate can be found at http://www-users.york.ac.uk/∼jb35/mygr2.htm. It is well known that the value of the bandwidth is of critical importance, while the shape of the kernel function has little practical impact. Assuming that the underlying density is sufficiently smooth and that the kernel has finite fourth moment, it can be shown using Taylor series that Bias{fˆ h(x)} = h2 2 µ2(K)f (x) + o(h2), Var{fˆ h(x)} = 1 nhR(K)f (x) + o 1 nh , where R(K) = K2(y) dy (e.g., Wand and Jones, 1995, pages 20–21). In addition to the visual advantage of being a smooth curve, the kernel estimate has an advantage over the histogram in terms of bias. The bias of a histogram estimator with bin width h is of order h, whereas centering the kernel at each data point and using a symmetric kernel zeroes this term and as such produces a leading bias term for the kernel estimate of order h2. Adding the leading variance and squared bias terms produces the asymptotic mean squared error (AMSE) AMSE{fˆ h(x)} = 1 nhR(K)f (x)+ h4 4 µ2(K)2[f (x)] 2. A widely used choice of an overall measure of the discrepancy between fˆ and f is the mean integrated squared error (MISE), which is given by MISE(fˆ h) = E fˆ h(y) − f (y)2 dy = Bias(fˆ h(y))2 dy + Var(fˆ h(y)) dy. Under an integrability assumption on f , integrating the expression for AMSE gives the expression for the asymptotic mean integrated squared error (AMISE), that is, AMISE{fˆ h} = 1 nhR(K) + h4 4 µ2(K)2R(f (3) ), where R(f ) = [f (y)] 2 dy. The value of the bandwidth that minimizes the AMISE is given by hAMISE = R(K) µ2(K)2R(f )
1/5 n−1/5 (4) . Assuming that f is sufficiently smooth, we can use integration by parts to show that R(f ) = [f (y)] 2 dy = − f (4) (y)f (y) dy. Thus, the functional R(f ) is a measure of the underlying roughness or curvature. In particular, the larger the value of R(f ) is, the larger is the value of AMISE (i.e., the more difficult it is to estimate f ) and the smaller is the value of hAMISE (i.e., the smaller the bandwidth needed to capture the curvature in f ). 3. BANDWIDTH SELECTION FOR KERNEL DENSITY ESTIMATES In this section, we briefly review methods for choosing a global value of the bandwidth h. Where applicable, reference is made to implementations of these methods in R, S-PLUS and SAS.����������������������