正在加载图片...
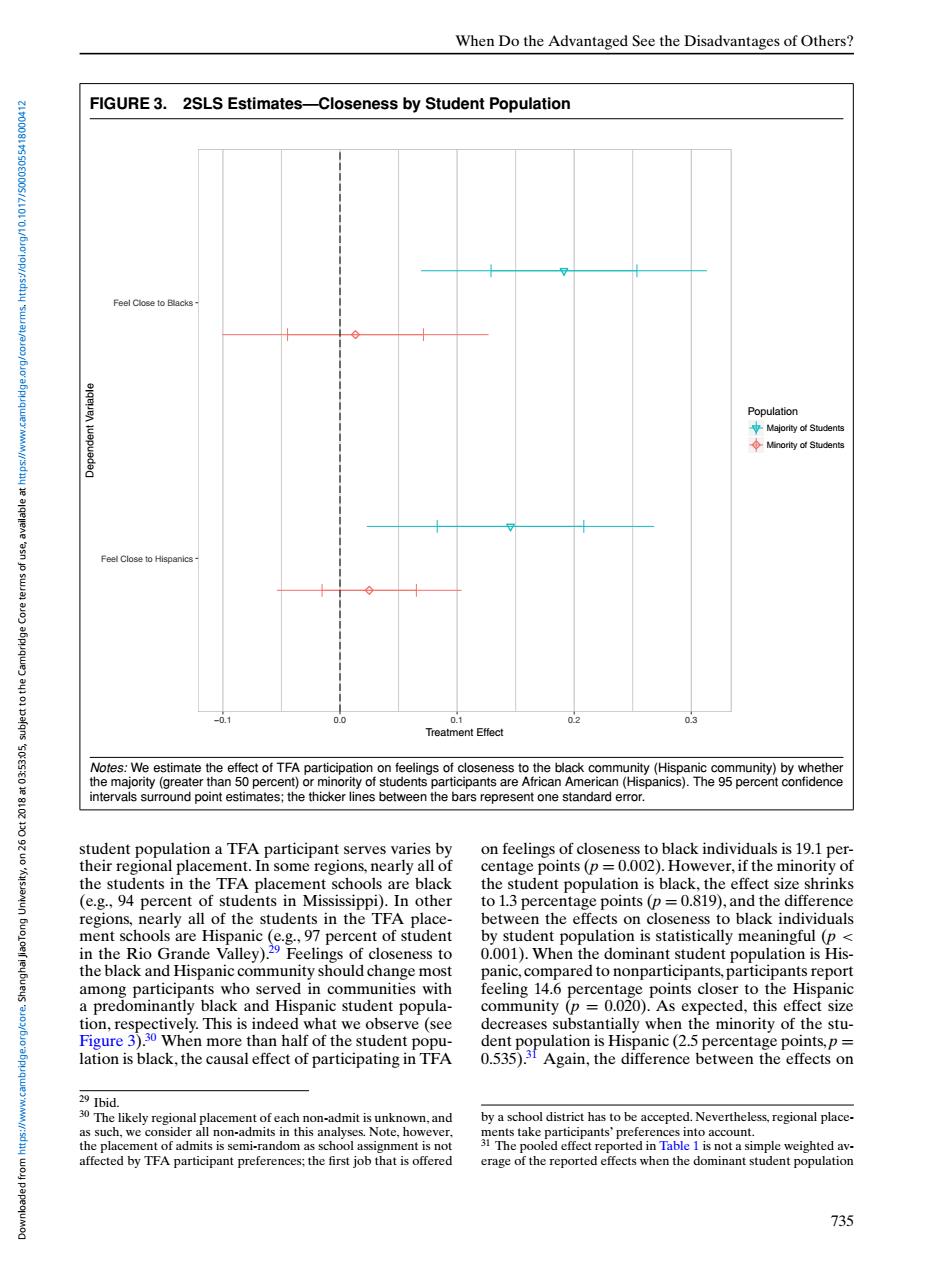
When Do the Advantaged See the Disadvantages of Others? FIGURE 3.2SLS Estimates-Closeness by Student Population Feel Close to Blacks Population ↓Majority of Students ◆Minority of Students Feel Close to Hispanics 0.1 Treatment Effect Notes:We estimate the effect of TFA participation on feelings of closeness to the black community(Hispanic community)by whether the majority (greater than 50 percent)or minority of students participants are African American(Hispanics).The 95 percent confidence intervals surround point estimates;the thicker lines between the bars represent one standard error. student population a TFA participant serves varies by on feelings of closeness to black individuals is 19.1 per- their regional placement.In some regions,nearly all of centage points(p =0.002).However,if the minority of the students in the TFA placement schools are black the student population is black,the effect size shrinks (e.g.,94 percent of students in Mississippi).In other to 1.3 percentage points (p=0.819),and the difference regions,nearly all of the students in the TFA place- between the effects on closeness to black individuals ment schools are Hispanic (e.g.,97 percent of student by student population is statistically meaningful (p in the Rio Grande Valley).29 Feelings of closeness to 0.001).When the dominant student population is His- the black and Hispanic community should change most panic,compared to nonparticipants,participants report among participants who served in communities with feeling 14.6 percentage points closer to the Hispanic a predominantly black and Hispanic student popula- community (p =0.020).As expected,this effect size tion,respectively.This is indeed what we observe (see decreases substantially when the minority of the stu- Figure 3).30 When more than half of the student popu- dent population is Hispanic(2.5 percentage points,p= lation is black,the causal effect of participating in TFA 0.535).31 Again,the difference between the effects on 29 Ibid. 30 The likely regional placement of each non-admit is unknown,and by a school district has to be accepted.Nevertheless,regional place- as such,we consider all non-admits in this analyses.Note,however the placement of admits is semi-random as school assignment is not epoome ihtedav affected by TFA participant preferences;the first job that is offered erage of the reported effects when the dominant student population 735When Do the Advantaged See the Disadvantages of Others? FIGURE 3. 2SLS Estimates—Closeness by Student Population Feel Close to Hispanics Feel Close to Blacks −0.1 0.0 0.1 0.2 0.3 Treatment Effect Dependent Variable Population Majority of Students Minority of Students Notes: We estimate the effect of TFA participation on feelings of closeness to the black community (Hispanic community) by whether the majority (greater than 50 percent) or minority of students participants are African American (Hispanics). The 95 percent confidence intervals surround point estimates; the thicker lines between the bars represent one standard error. student population a TFA participant serves varies by their regional placement. In some regions, nearly all of the students in the TFA placement schools are black (e.g., 94 percent of students in Mississippi). In other regions, nearly all of the students in the TFA placement schools are Hispanic (e.g., 97 percent of student in the Rio Grande Valley).29 Feelings of closeness to the black and Hispanic community should change most among participants who served in communities with a predominantly black and Hispanic student population, respectively. This is indeed what we observe (see Figure 3).30 When more than half of the student population is black, the causal effect of participating in TFA 29 Ibid. 30 The likely regional placement of each non-admit is unknown, and as such, we consider all non-admits in this analyses. Note, however, the placement of admits is semi-random as school assignment is not affected by TFA participant preferences; the first job that is offered on feelings of closeness to black individuals is 19.1 percentage points (p = 0.002). However, if the minority of the student population is black, the effect size shrinks to 1.3 percentage points (p = 0.819), and the difference between the effects on closeness to black individuals by student population is statistically meaningful (p < 0.001). When the dominant student population is Hispanic, compared to nonparticipants, participants report feeling 14.6 percentage points closer to the Hispanic community (p = 0.020). As expected, this effect size decreases substantially when the minority of the student population is Hispanic (2.5 percentage points, p = 0.535).31 Again, the difference between the effects on by a school district has to be accepted. Nevertheless, regional placements take participants’ preferences into account. 31 The pooled effect reported in Table 1 is not a simple weighted average of the reported effects when the dominant student population 735 Downloaded from https://www.cambridge.org/core. Shanghai JiaoTong University, on 26 Oct 2018 at 03:53:05, subject to the Cambridge Core terms of use, available at https://www.cambridge.org/core/terms. https://doi.org/10.1017/S0003055418000412