正在加载图片...
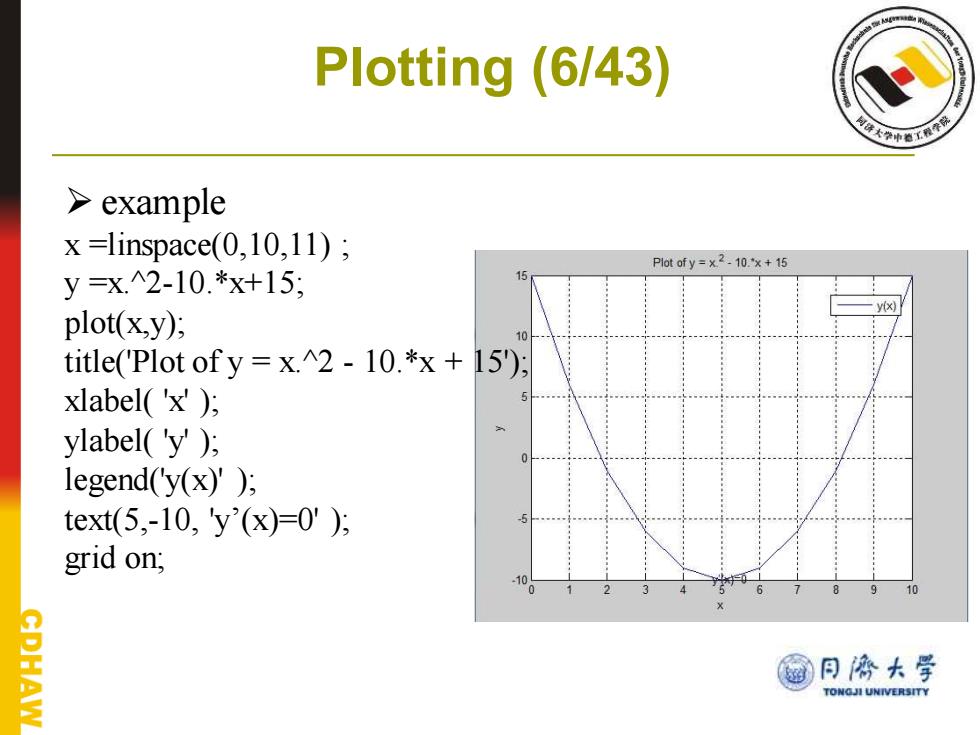
Plotting (6/43) example x =linspace(0,10,11); Plot of y =x2 -10.'x+15 y=x2-10.*x+15; y(x) plot(x,y); title('Plot of y x.2-10.*x+15); xlabel('x') ylabel('y') legend('y(x)'); text(5,-10,y(x)=0'); grid on; CPHAW @月协大学 TONGJI UNIVERSITYPlotting (6/43) ➢ example x =linspace(0,10,11) ; y =x.^2-10.*x+15; plot(x,y); title('Plot of y = x.^2 - 10.*x + 15'); xlabel( 'x' ); ylabel( 'y' ); legend('y(x)' ); text(5,-10, 'y’(x)=0' ); grid on;