正在加载图片...
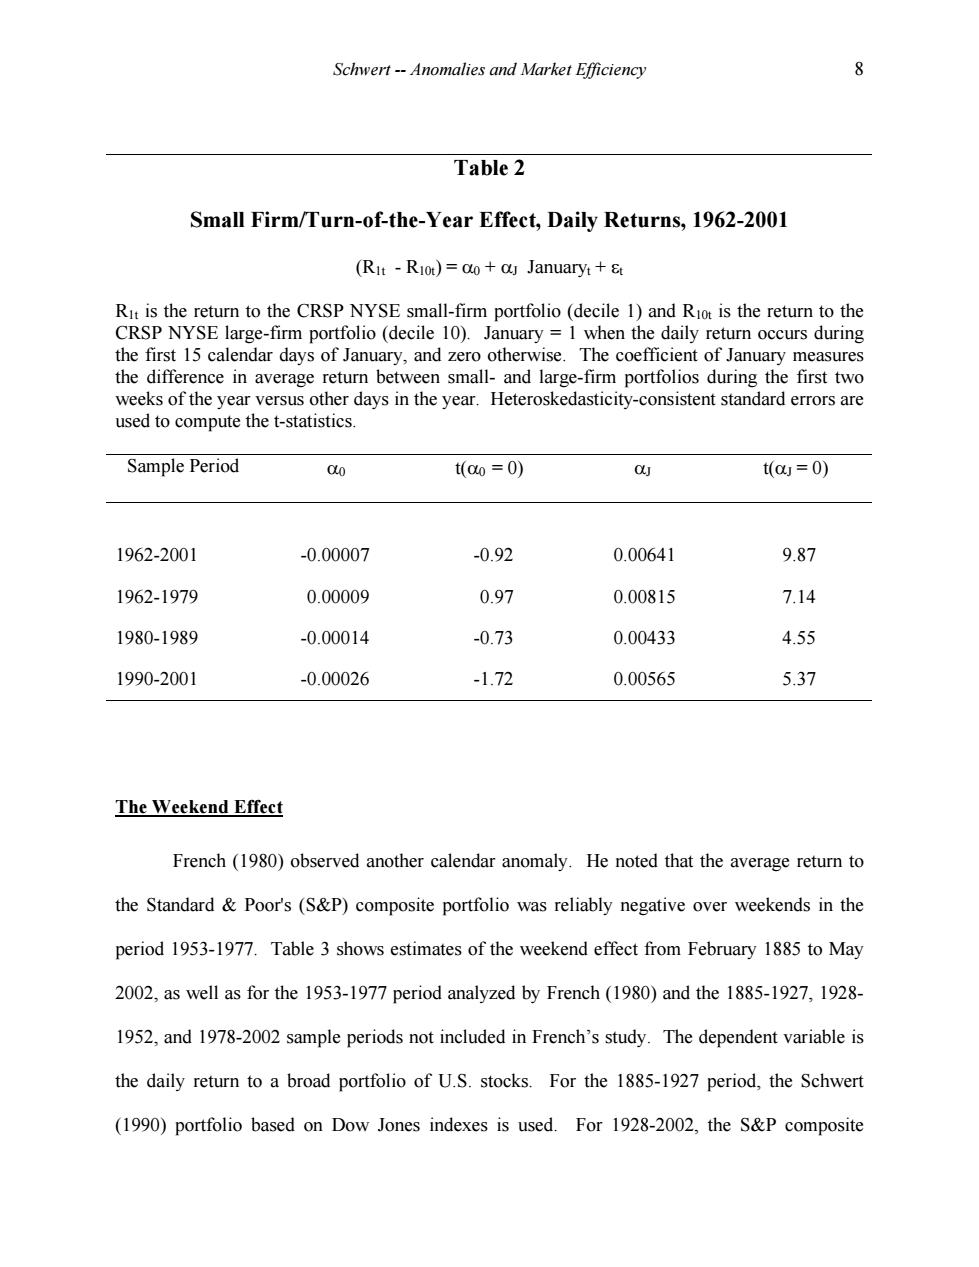
Schwert--Anomalies and Market Efficiency 8 Table 2 Small Firm/Turn-of-the-Year Effect,Daily Returns,1962-2001 (Rit -Riot)=ao a Januaryt+ Rit is the return to the CRSP NYSE small-firm portfolio (decile 1)and Riot is the return to the CRSP NYSE large-firm portfolio (decile 10).January 1 when the daily return occurs during the first 15 calendar days of January,and zero otherwise.The coefficient of January measures the difference in average return between small-and large-firm portfolios during the first two weeks of the year versus other days in the year.Heteroskedasticity-consistent standard errors are used to compute the t-statistics. Sample Period 00 t(00=0) 0 t(0=0) 1962-2001 -0.00007 -0.92 0.00641 9.87 1962-1979 0.00009 0.97 0.00815 7.14 1980-1989 -0.00014 -0.73 0.00433 4.55 1990-2001 -0.00026 -1.72 0.00565 5.37 The Weekend Effect French (1980)observed another calendar anomaly.He noted that the average return to the Standard Poor's(S&P)composite portfolio was reliably negative over weekends in the period 1953-1977.Table 3 shows estimates of the weekend effect from February 1885 to May 2002,as well as for the 1953-1977 period analyzed by French(1980)and the 1885-1927,1928- 1952,and 1978-2002 sample periods not included in French's study.The dependent variable is the daily return to a broad portfolio of U.S.stocks.For the 1885-1927 period,the Schwert (1990)portfolio based on Dow Jones indexes is used.For 1928-2002,the S&P compositeSchwert -- Anomalies and Market Efficiency 8 Table 2 Small Firm/Turn-of-the-Year Effect, Daily Returns, 1962-2001 (R1t - R10t) = a0 + aJ Januaryt + et R1t is the return to the CRSP NYSE small-firm portfolio (decile 1) and R10t is the return to the CRSP NYSE large-firm portfolio (decile 10). January = 1 when the daily return occurs during the first 15 calendar days of January, and zero otherwise. The coefficient of January measures the difference in average return between small- and large-firm portfolios during the first two weeks of the year versus other days in the year. Heteroskedasticity-consistent standard errors are used to compute the t-statistics. Sample Period a0 t(a0 = 0) aJ t(aJ = 0) 1962-2001 -0.00007 -0.92 0.00641 9.87 1962-1979 0.00009 0.97 0.00815 7.14 1980-1989 -0.00014 -0.73 0.00433 4.55 1990-2001 -0.00026 -1.72 0.00565 5.37 The Weekend Effect French (1980) observed another calendar anomaly. He noted that the average return to the Standard & Poor's (S&P) composite portfolio was reliably negative over weekends in the period 1953-1977. Table 3 shows estimates of the weekend effect from February 1885 to May 2002, as well as for the 1953-1977 period analyzed by French (1980) and the 1885-1927, 1928- 1952, and 1978-2002 sample periods not included in French’s study. The dependent variable is the daily return to a broad portfolio of U.S. stocks. For the 1885-1927 period, the Schwert (1990) portfolio based on Dow Jones indexes is used. For 1928-2002, the S&P composite