正在加载图片...
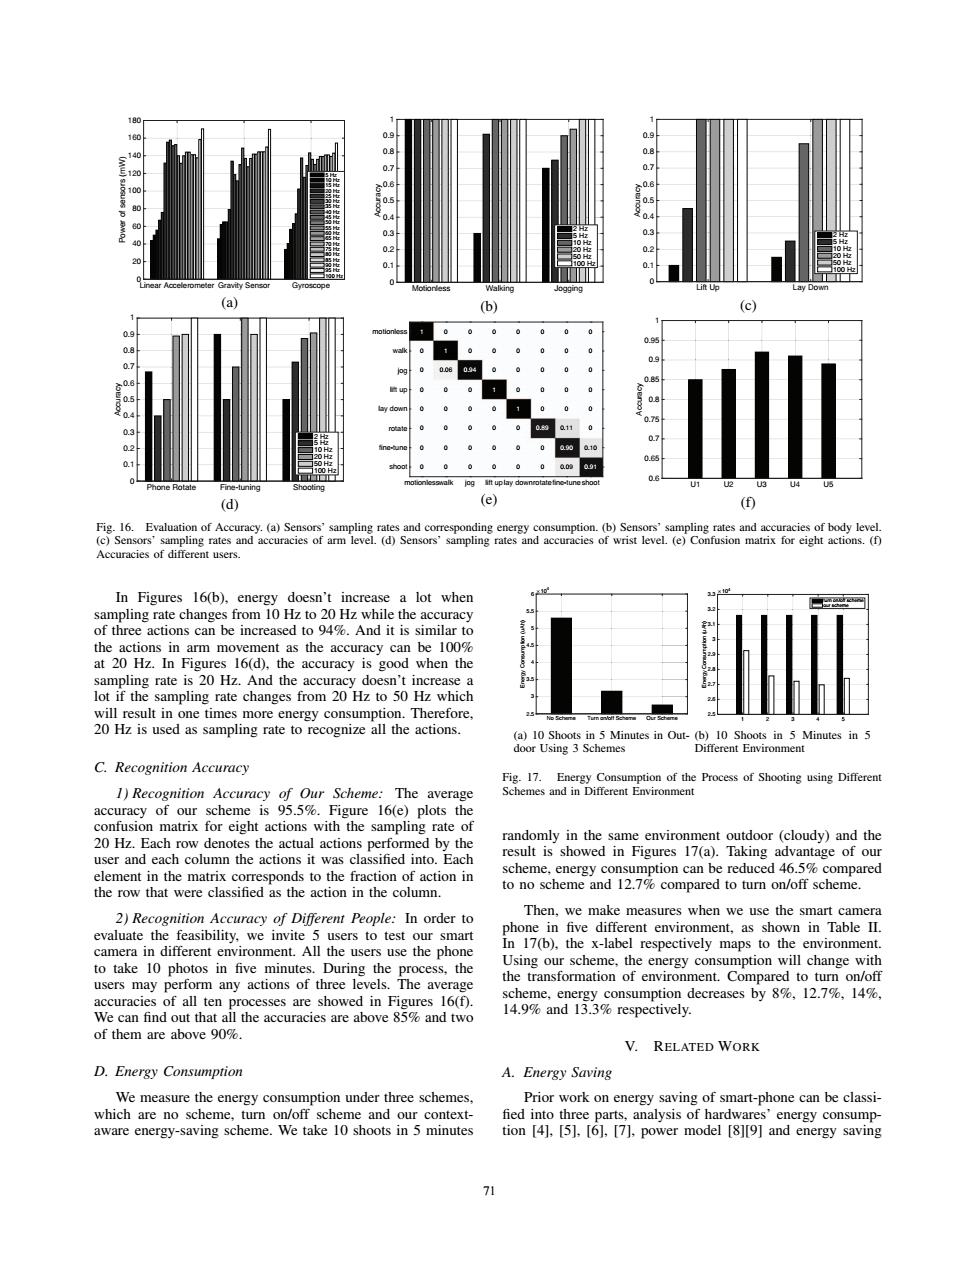
180 140 0 120 0.6 6 80 0.4 0. ter Gravity Sensor (a) (c) 09 0.7 06 s 0.2 07 0.1 Fine-tuning og litt uplay do (d) (e) ⊙ Fig.16.Evaluation of Accuracy.(a)Sensors'sampling rates and corresponding energy consumption.(b)Sensors'sampling rates and accuracies of body level. (c)Sensors'sampling rates and accuracies of arm level.(d)Sensors'sampling rates and accuracies of wrist level.(e)Confusion matrix for eight actions.(f) Accuracies of different users. In Figures 16(b),energy doesn't increase a lot when sampling rate changes from 10 Hz to 20 Hz while the accuracy of three actions can be increased to 94%.And it is similar to the actions in arm movement as the accuracy can be 100% at 20 Hz.In Figures 16(d),the accuracy is good when the sampling rate is 20 Hz.And the accuracy doesn't increase a lot if the sampling rate changes from 20 Hz to 50 Hz which will result in one times more energy consumption.Therefore, 20 Hz is used as sampling rate to recognize all the actions. (a)10 Shoots in 5 Minutes in Out-(b)10 Shoots in 5 Minutes in 5 door Using 3 Schemes Different Environment C.Recognition Accuracy Fig.17.Energy Consumption of the Process of Shooting using Different 1)Recognition Accuracy of Our Scheme:The average Schemes and in Different Environment accuracy of our scheme is 95.5%.Figure 16(e)plots the confusion matrix for eight actions with the sampling rate of 20 Hz.Each row denotes the actual actions performed by the randomly in the same environment outdoor (cloudy)and the user and each column the actions it was classified into.Each result is showed in Figures 17(a).Taking advantage of our element in the matrix corresponds to the fraction of action in scheme,energy consumption can be reduced 46.5%compared the row that were classified as the action in the column. to no scheme and 12.7%compared to turn on/off scheme. 2)Recognition Accuracy of Different People:In order to Then,we make measures when we use the smart camera evaluate the feasibility,we invite 5 users to test our smart phone in five different environment,as shown in Table II. camera in different environment.All the users use the phone In 17(b),the x-label respectively maps to the environment. to take 10 photos in five minutes.During the process,the Using our scheme,the energy consumption will change with users may perform any actions of three levels.The average the transformation of environment.Compared to turn on/off accuracies of all ten processes are showed in Figures 16(f). scheme,energy consumption decreases by 8%,12.7%,14%, We can find out that all the accuracies are above 85%and two 14.9%and 13.3%respectively. of them are above 90%. V.RELATED WORK D.Energy Consumption A.Energy Saving We measure the energy consumption under three schemes. Prior work on energy saving of smart-phone can be classi- which are no scheme.turn on/off scheme and our context- fied into three parts,analysis of hardwares'energy consump- aware energy-saving scheme.We take 10 shoots in 5 minutes tion [4].[5].[6],[7].power model [8][9]and energy saving 71Linear Accelerometer Gravity Sensor Gyroscope Power of sensors (mW) 0 20 40 60 80 100 120 140 160 180 5 Hz 10 Hz 15 Hz 20 Hz 25 Hz 30 Hz 35 Hz 40 Hz 45 Hz 50 Hz 55 Hz 60 Hz 65 Hz 70 Hz 75 Hz 80 Hz 85 Hz 90 Hz 95 Hz 100 Hz (a) Motionless Walking Jogging Accuracy 0 0.1 0.2 0.3 0.4 0.5 0.6 0.7 0.8 0.9 1 2 Hz 5 Hz 10 Hz 20 Hz 50 Hz 100 Hz (b) Lift Up Lay Down Accuracy 0 0.1 0.2 0.3 0.4 0.5 0.6 0.7 0.8 0.9 1 2 Hz 5 Hz 10 Hz 20 Hz 50 Hz 100 Hz (c) Phone Rotate Fine-tuning Shooting Accuracy 0 0.1 0.2 0.3 0.4 0.5 0.6 0.7 0.8 0.9 1 2 Hz 5 Hz 10 Hz 20 Hz 50 Hz 100 Hz (d) 1 0 0 0 0 0 0 0 0 1 0.06 0 0 0 0 0 0 0 0.94 0 0 0 0 0 0 0 0 1 0 0 0 0 0 0 0 0 1 0 0 0 0 0 0 0 0 0.89 0 0 0 0 0 0 0 0.11 0.90 0.09 0 0 0 0 0 0 0.10 0.91 motionlesswalk jog lift uplay downrotatefine-tuneshoot motionless walk jog lift up lay down rotate fine-tune shoot (e) U1 U2 U3 U4 U5 Accuracy 0.6 0.65 0.7 0.75 0.8 0.85 0.9 0.95 1 (f) Fig. 16. Evaluation of Accuracy. (a) Sensors’ sampling rates and corresponding energy consumption. (b) Sensors’ sampling rates and accuracies of body level. (c) Sensors’ sampling rates and accuracies of arm level. (d) Sensors’ sampling rates and accuracies of wrist level. (e) Confusion matrix for eight actions. (f) Accuracies of different users. In Figures 16(b), energy doesn’t increase a lot when sampling rate changes from 10 Hz to 20 Hz while the accuracy of three actions can be increased to 94%. And it is similar to the actions in arm movement as the accuracy can be 100% at 20 Hz. In Figures 16(d), the accuracy is good when the sampling rate is 20 Hz. And the accuracy doesn’t increase a lot if the sampling rate changes from 20 Hz to 50 Hz which will result in one times more energy consumption. Therefore, 20 Hz is used as sampling rate to recognize all the actions. C. Recognition Accuracy 1) Recognition Accuracy of Our Scheme: The average accuracy of our scheme is 95.5%. Figure 16(e) plots the confusion matrix for eight actions with the sampling rate of 20 Hz. Each row denotes the actual actions performed by the user and each column the actions it was classified into. Each element in the matrix corresponds to the fraction of action in the row that were classified as the action in the column. 2) Recognition Accuracy of Different People: In order to evaluate the feasibility, we invite 5 users to test our smart camera in different environment. All the users use the phone to take 10 photos in five minutes. During the process, the users may perform any actions of three levels. The average accuracies of all ten processes are showed in Figures 16(f). We can find out that all the accuracies are above 85% and two of them are above 90%. D. Energy Consumption We measure the energy consumption under three schemes, which are no scheme, turn on/off scheme and our contextaware energy-saving scheme. We take 10 shoots in 5 minutes No Scheme Turn on/off Scheme Our Scheme Energy Consumption (uAh) 104 2.5 3 3.5 4 4.5 5 5.5 6 (a) 10 Shoots in 5 Minutes in Outdoor Using 3 Schemes 12345 Energy Consumption (uAh) 104 2.5 2.6 2.7 2.8 2.9 3 3.1 3.2 3.3 turn on/off scheme our scheme (b) 10 Shoots in 5 Minutes in 5 Different Environment Fig. 17. Energy Consumption of the Process of Shooting using Different Schemes and in Different Environment randomly in the same environment outdoor (cloudy) and the result is showed in Figures 17(a). Taking advantage of our scheme, energy consumption can be reduced 46.5% compared to no scheme and 12.7% compared to turn on/off scheme. Then, we make measures when we use the smart camera phone in five different environment, as shown in Table II. In 17(b), the x-label respectively maps to the environment. Using our scheme, the energy consumption will change with the transformation of environment. Compared to turn on/off scheme, energy consumption decreases by 8%, 12.7%, 14%, 14.9% and 13.3% respectively. V. RELATED WORK A. Energy Saving Prior work on energy saving of smart-phone can be classi- fied into three parts, analysis of hardwares’ energy consumption [4], [5], [6], [7], power model [8][9] and energy saving 71��