正在加载图片...
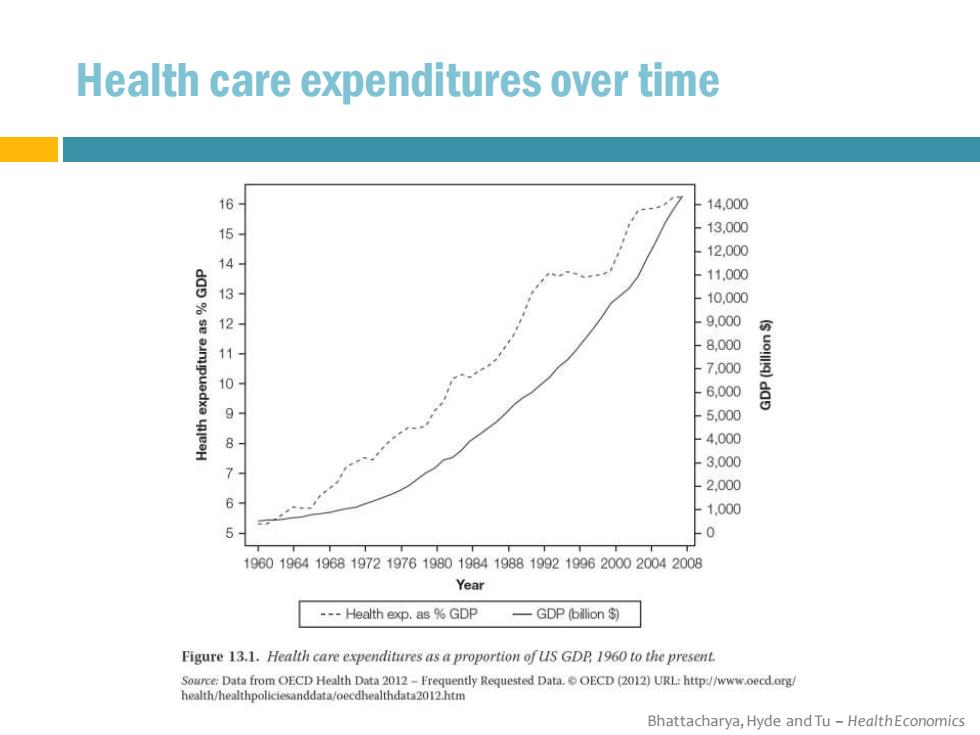
Health care expenditures over time 6 14.000 13.000 54821 12.000 11.000 10.000 9.000 8.000 7.000 098 6.000 5.000 4.000 3.000 7 2.000 1.000 0 1960196419681972197619801984198819921996200020042008 Year ---Health exp.as GDP -GDP (billion$周 Figure 13.1.Health care expenditures as a proportion ofUS GDP 1960 to the present Source:Data from OECD Health Data 2012-Frequently Requested Data.OECD(2012)URL:http://www.oecdong/ Bhattacharya,Hyde and Tu-HealthEconomicsBhattacharya, Hyde and Tu – Health Economics Health care expenditures over time