正在加载图片...

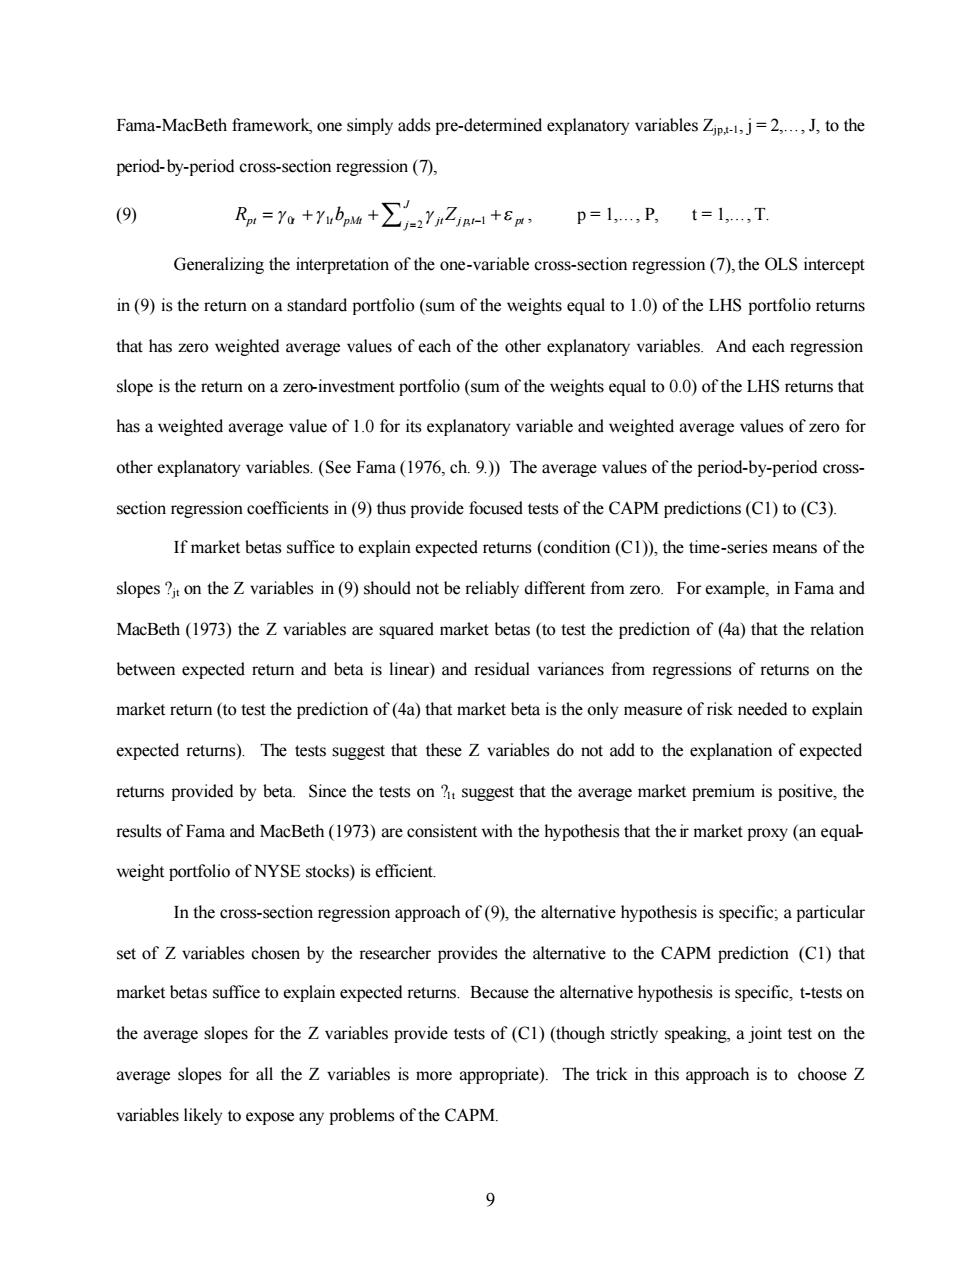
Fama-MacBeth framework,one simply adds pre-determined explanatory variables Zip.,j=2....,J,to the period-by-period cross-section regression(7), (9) R=%+7bw+∑nZ+8,p=l,,卫t=l,T Generalizing the interpretation of the one-variable cross-section regression(7),the OLS intercept in(9)is the return on a standard portfolio (sum of the weights equal to 1.0)of the LHS portfolio returns that has zero weighted average values of each of the other explanatory variables.And each regression slope is the return on a zero-investment portfolio(sum of the weights equal to 0.0)of the LHS returns that has a weighted average value of 1.0 for its explanatory variable and weighted average values of zero for other explanatory variables.(See Fama(1976,ch.9.))The average values of the period-by-period cross- section regression coefficients in(9)thus provide focused tests of the CAPM predictions(C1)to(C3) If market betas suffice to explain expected returns(condition(C1)),the time-series means of the slopes ?it on the Z variables in(9)should not be reliably different from zero.For example,in Fama and MacBeth(1973)the Z variables are squared market betas (to test the prediction of(4a)that the relation between expected return and beta is linear)and residual variances from regressions of returns on the market return(to test the prediction of(4a)that market beta is the only measure of risk needed to explain expected returns).The tests suggest that these Z variables do not add to the explanation of expected returns provided by beta.Since the tests on ?t suggest that the average market premium is positive,the results of Fama and MacBeth(1973)are consistent with the hypothesis that the ir market proxy(an equal weight portfolio of NYSE stocks)is efficient. In the cross-section regression approach of(9),the alternative hypothesis is specific;a particular set of Z variables chosen by the researcher provides the alternative to the CAPM prediction (C1)that market betas suffice to explain expected returns.Because the alternative hypothesis is specific,t-tests on the average slopes for the Z variables provide tests of(C1)(though strictly speaking,a joint test on the average slopes for all the Z variables is more appropriate).The trick in this approach is to choose Z variables likely to expose any problems of the CAPM. 99 Fama-MacBeth framework, one simply adds pre-determined explanatory variables Zjp,t-1, j = 2,…, J, to the period-by-period cross-section regression (7), (9) 0 1 , 1 2 J pt t t pMt jt j p t pt j R g g b Z g e - = = + + + å , p = 1,…, P, t = 1,…, T. Generalizing the interpretation of the one-variable cross-section regression (7), the OLS intercept in (9) is the return on a standard portfolio (sum of the weights equal to 1.0) of the LHS portfolio returns that has zero weighted average values of each of the other explanatory variables. And each regression slope is the return on a zero-investment portfolio (sum of the weights equal to 0.0) of the LHS returns that has a weighted average value of 1.0 for its explanatory variable and weighted average values of zero for other explanatory variables. (See Fama (1976, ch. 9.)) The average values of the period-by-period crosssection regression coefficients in (9) thus provide focused tests of the CAPM predictions (C1) to (C3). If market betas suffice to explain expected returns (condition (C1)), the time-series means of the slopes ?jt on the Z variables in (9) should not be reliably different from zero. For example, in Fama and MacBeth (1973) the Z variables are squared market betas (to test the prediction of (4a) that the relation between expected return and beta is linear) and residual variances from regressions of returns on the market return (to test the prediction of (4a) that market beta is the only measure of risk needed to explain expected returns). The tests suggest that these Z variables do not add to the explanation of expected returns provided by beta. Since the tests on ?1t suggest that the average market premium is positive, the results of Fama and MacBeth (1973) are consistent with the hypothesis that the ir market proxy (an equalweight portfolio of NYSE stocks) is efficient. In the cross-section regression approach of (9), the alternative hypothesis is specific; a particular set of Z variables chosen by the researcher provides the alternative to the CAPM prediction (C1) that market betas suffice to explain expected returns. Because the alternative hypothesis is specific, t-tests on the average slopes for the Z variables provide tests of (C1) (though strictly speaking, a joint test on the average slopes for all the Z variables is more appropriate). The trick in this approach is to choose Z variables likely to expose any problems of the CAPM