正在加载图片...
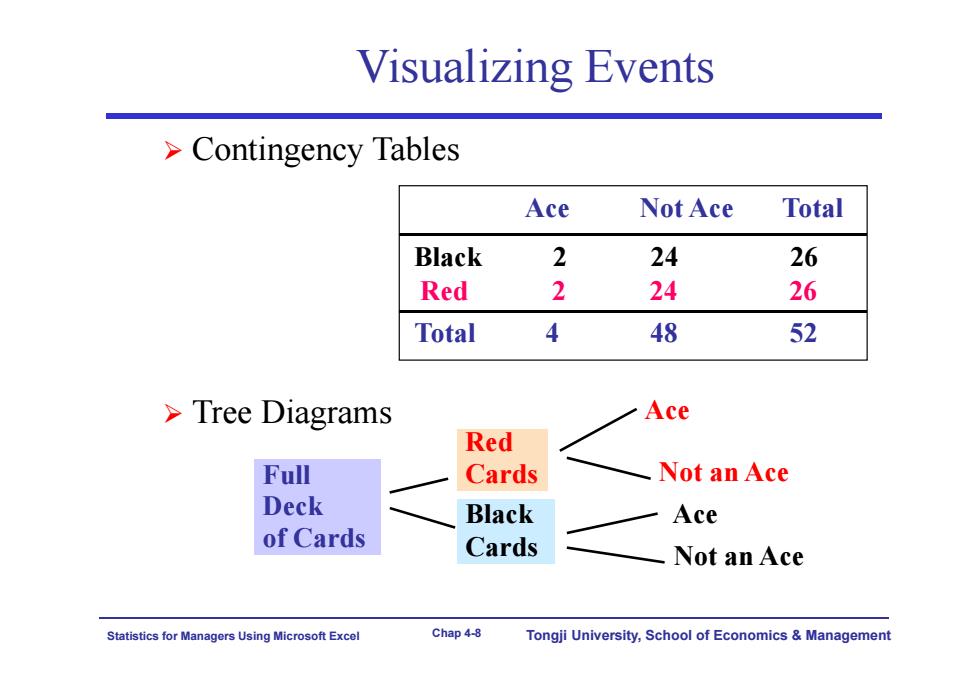
Visualizing Events >Contingency Tables Ace Not Ace Total Black 2 24 26 Red 2 24 26 Total 4 48 52 >Tree Diagrams Ace Red Full Cards Not an Ace Deck Black Ace of Cards Cards Not an Ace Statistics for Ma agers Using Microsoft Excel Chap 4-8 Tongji University,School of Economics ManagementStatistics for Managers Using Microsoft Excel Chap 4-8 Tongji University, School of Economics & Management Visualizing Events Contingency Tables Tree Diagrams Red 2 24 26 Black 2 24 26 Total 4 48 52 Ace Not Ace Total Full Deck of Cards Red Cards Black Cards Not an Ace Ace Ace Not an Ace