正在加载图片...
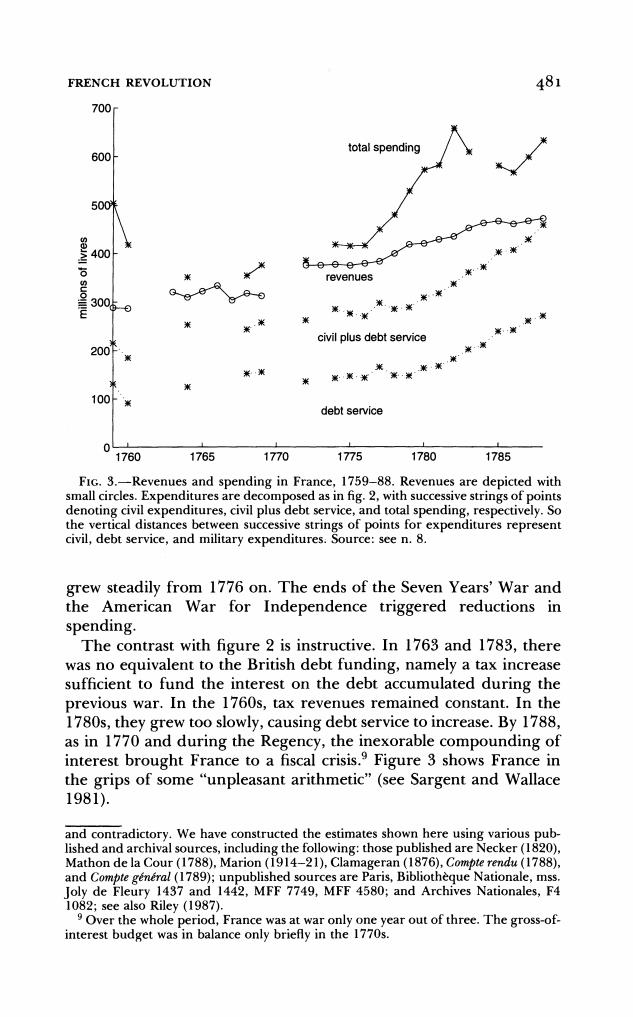
FRENCH REVOLUTION 481 700 total spending 600 500% revenues 3005 米 civil plus debt service 200F 米 米米 黑黑·米 100F debt service 0 1760 1765 1770 1775 1780 1785 FIG.3.-Revenues and spending in France,1759-88.Revenues are depicted with small circles.Expenditures are decomposed as in fig.2,with successive strings of points denoting civil expenditures,civil plus debt service,and total spending,respectively.So the vertical distances between successive strings of points for expenditures represent civil,debt service,and military expenditures.Source:see n.8. grew steadily from 1776 on.The ends of the Seven Years'War and the American War for Independence triggered reductions in spending. The contrast with figure 2 is instructive.In 1763 and 1783,there was no equivalent to the British debt funding,namely a tax increase sufficient to fund the interest on the debt accumulated during the previous war.In the 1760s,tax revenues remained constant.In the 1780s,they grew too slowly,causing debt service to increase.By 1788, as in 1770 and during the Regency,the inexorable compounding of interest brought France to a fiscal crisis.9 Figure 3 shows France in the grips of some "unpleasant arithmetic"(see Sargent and Wallace 1981). and contradictory.We have constructed the estimates shown here using various pub- lished and archival sources,including the following:those published are Necker(1820), Mathon de la Cour (1788),Marion(1914-21),Clamageran (1876),Compte rendu (1788), and Compte general(1789);unpublished sources are Paris,Bibliotheque Nationale,mss. Joly de Fleury 1437 and 1442,MFF 7749,MFF 4580;and Archives Nationales,F4 1082;see also Riley (1987). 9 Over the whole period,France was at war only one year out of three.The gross-of- interest budget was in balance only briefly in the 1770s.FRENCH REVOLUTION 481 700 6001 -total spending 500 >400 O )K revenues )K- -~3000 * *| * >3 * 3 , ~~~~~~civil plus debt service *f 3 200 * i 0 ) K O 3 K )K' 100( )K 100 debt service 1760 1765 1770 1775 1780 1785 FIG. 3.-Revenues and spending in France, 1759-88. Revenues are depicted with small circles. Expenditures are decomposed as in fig. 2, with successive strings of points denoting civil expenditures, civil plus debt service, and total spending, respectively. So the vertical distances between successive strings of points for expenditures represent civil, debt service, and military expenditures. Source: see n. 8. grew steadily from 1776 on. The ends of the Seven Years' War and the American War for Independence triggered reductions in spending. The contrast with figure 2 is instructive. In 1763 and 1783, there was no equivalent to the British debt funding, namely a tax increase sufficient to fund the interest on the debt accumulated during the previous war. In the 1760s, tax revenues remained constant. In the 1780s, they grew too slowly, causing debt service to increase. By 1788, as in 1770 and during the Regency, the inexorable compounding of interest brought France to a fiscal crisis.9 Figure 3 shows France in the grips of some "unpleasant arithmetic" (see Sargent and Wallace 1981). and contradictory. We have constructed the estimates shown here using various published and archival sources, including the following: those published are Necker (1820), Mathon de la Cour (1788), Marion (1914-21), Clamageran (1876), Compte rendu (1788), and Compte ggngral (1789); unpublished sources are Paris, Bibliotheque Nationale, mss. Joly de Fleury 1437 and 1442, MFF 7749, MFF 4580; and Archives Nationales, F4 1082; see also Riley (1987). 9 Over the whole period, France was at war only one year out of three. The gross-ofinterest budget was in balance only briefly in the 1770s