正在加载图片...
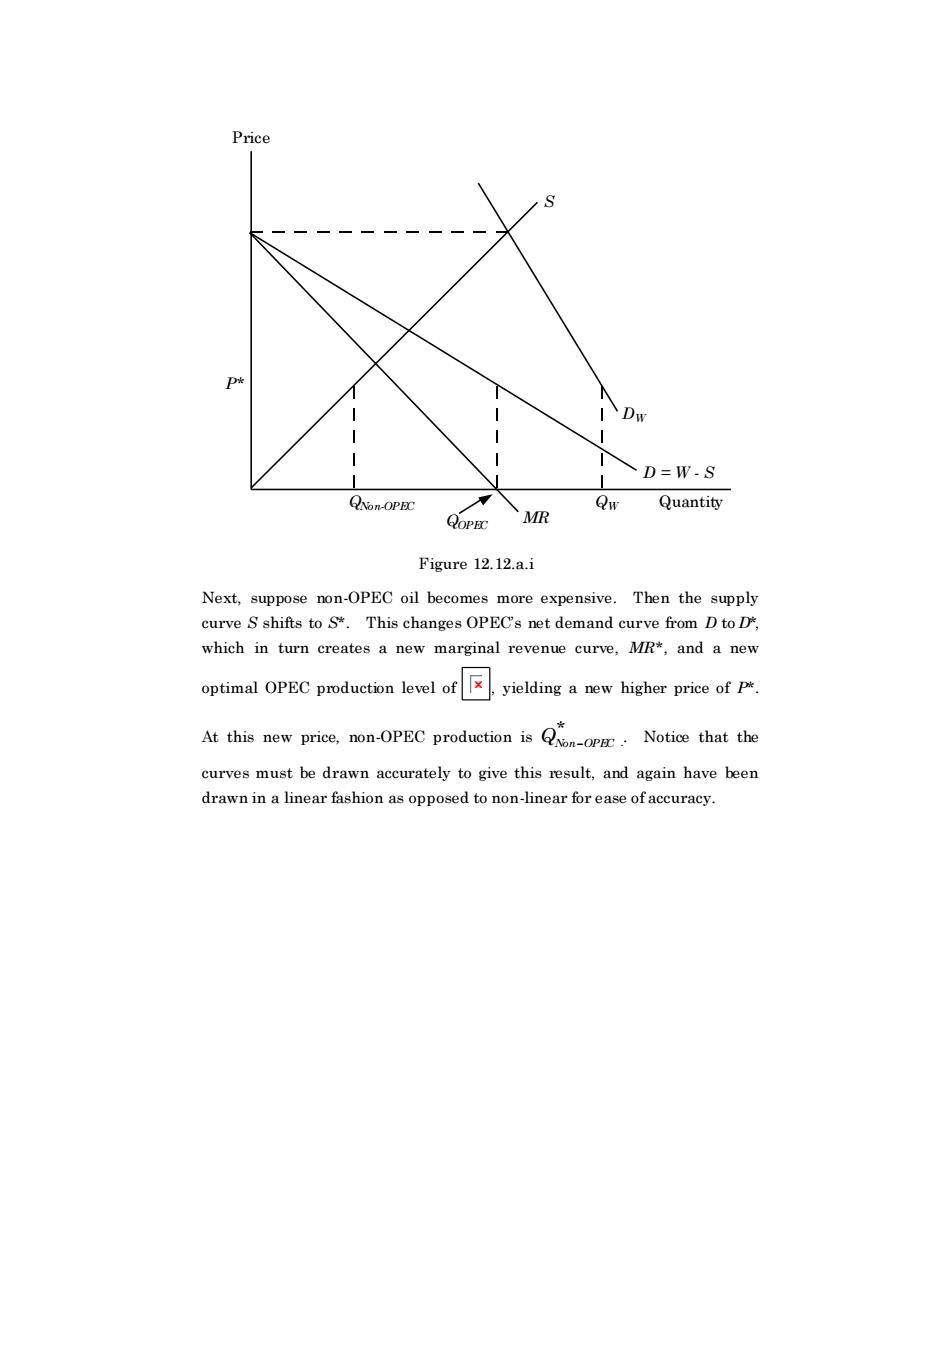
Price D=W.S Quantity Figure 12.12.a.i ose non-OPEC oil becomes more curv This changesOPECs net demand which in turn creates a new marginal revenue curve.MR"and a new optimal OPEC production level of.yielding a new higher price of P At this new price,non-OPEC production is Notice that the curves must be drawn accurately to give this result,and again have been drawn in a linear fashion as opposed to non-linear for ease of accuracy.Price Quantity MR D = W - S S QW DW QNon-OPEC P* QOPEC Figure 12.12.a.i Next, suppose non-OPEC oil becomes more expensive. Then the supply curve S shifts to S*. This changes OPEC’s net demand curve from D to D*, which in turn creates a new marginal revenue curve, MR*, and a new optimal OPEC production level of , yielding a new higher price of P*. At this new price, non-OPEC production is QNon−OPEC * . . Notice that the curves must be drawn accurately to give this result, and again have been drawn in a linear fashion as opposed to non-linear for ease of accuracy