正在加载图片...
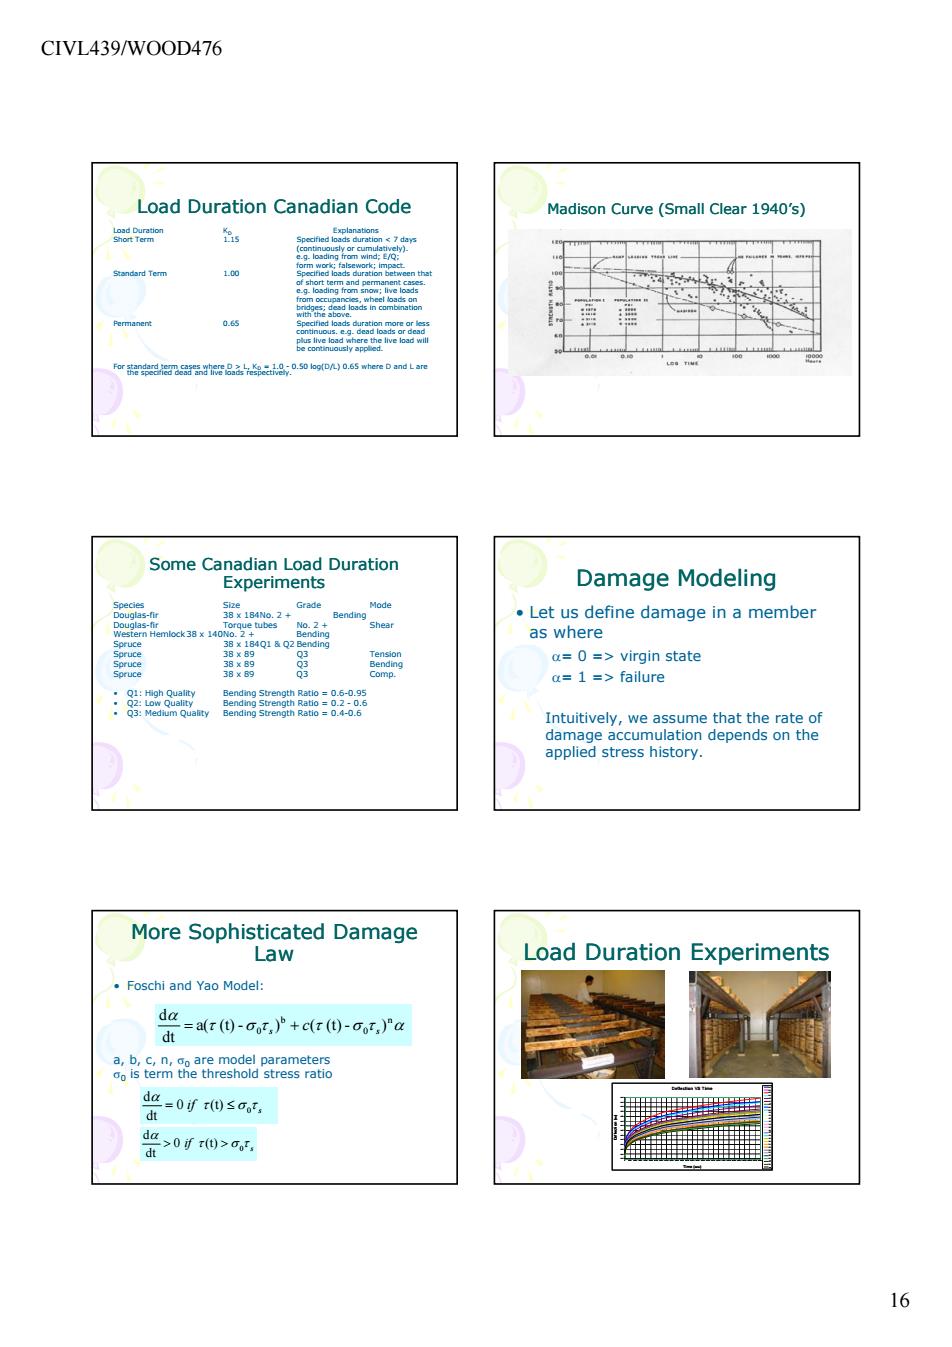
CIVL439/WO0D476 Load Duration Canadian Code Madison Curve(Small Clear 1940's) Some Canadian Load Duratior Experiments Damage Modeling 密 0=>virgin state a=1=>failure :群觉: applied stress history. More Sophisticated Damage Law Load Duration Experiments Foschi and Yao Model: dg=r0-o,P+dr0-r广a a,ahaf0ePraTetee daf 0>0f>g 16 CIVL439/WOOD476 16 Load Duration Canadian Code Load Duration KD Explanations Short Term 1.15 Specified loads duration < 7 days (continuously or cumulatively). e.g. loading from wind; E/Q; form work; falsework; impact. Standard Term 1.00 Specified loads duration between that of short term and permanent cases. e.g. loading from snow; live loads from occupancies wheel loads on from occupancies, wheel loads on bridges; dead loads in combination with the above. Permanent 0.65 Specified loads duration more or less continuous. e.g. dead loads or dead plus live load where the live load will be continuously applied. For standard term cases where D > L, KD = 1.0 - 0.50 log(D/L) 0.65 where D and L are the specified dead and live loads respectively. Madison Curve (Small Clear 1940’s) 50 100 150 200 Stress Ratio (%) Empirical Hyperbolic Curve DOL data used in Curve Fitting 0 -5 0 5 10 Stress Duration to Failure - Log10(second) S Elmendorf Data Point Some Canadian Load Duration Experiments Species Size Grade Mode Douglas-fir 38 x 184No. 2 + Bending Douglas-fir Torque tubes No. 2 + Shear Western Hemlock 38 x 140No. 2 + Bending Spruce 38 x 184Q1 & Q2 Bending Spruce 38 x 89 Q3 Tension Spruce 38 x 89 Q3 Bending Spruce 38 x 89 Q3 Comp. • Q1: High Quality Bending Strength Ratio = 0.6-0.95 • Q2: Low Quality Bending Strength Ratio = 0.2 - 0.6 • Q3: Medium Quality Bending Strength Ratio = 0.4-0.6 Damage Modeling • Let us define damage in a member as where α= 0 => virgin state α= 1 f il 1 => failure Intuitively, we assume that the rate of damage accumulation depends on the applied stress history. More Sophisticated Damage Law • Foschi and Yao Model: a( (t) - ) ( (t) - ) dt d n 0 b τ σ 0 τ τ σ τ α α s s = + c a, b, c, n, σ0 are model parameters σ0 is term the threshold stress ratio 0 (t) dt d 0 s if τ σ τ α = ≤ s if τ σ τ α 0 0 (t) dt d > > Load Duration Experiments Deflection VS Time 0.25 0.30 0.35 0.40 0.45 0.50 0.55 0.60 0.65 0.70 0.75 0.80 0.85 0.90 0 5000 10000 15000 20000 25000 30000 35000 40000 45000 50000 55000 60000 65000 70000 75000 80000 85000 90000 95000 100000 105000 110000 115000 120000 125000 130000 Time (min) Deflection (in) 01 02 03 04 05 06 07 08 09 10 11 12 13 14 15 16 17 18 19 20 21 22 23 24 25 26 27 28 Av