正在加载图片...
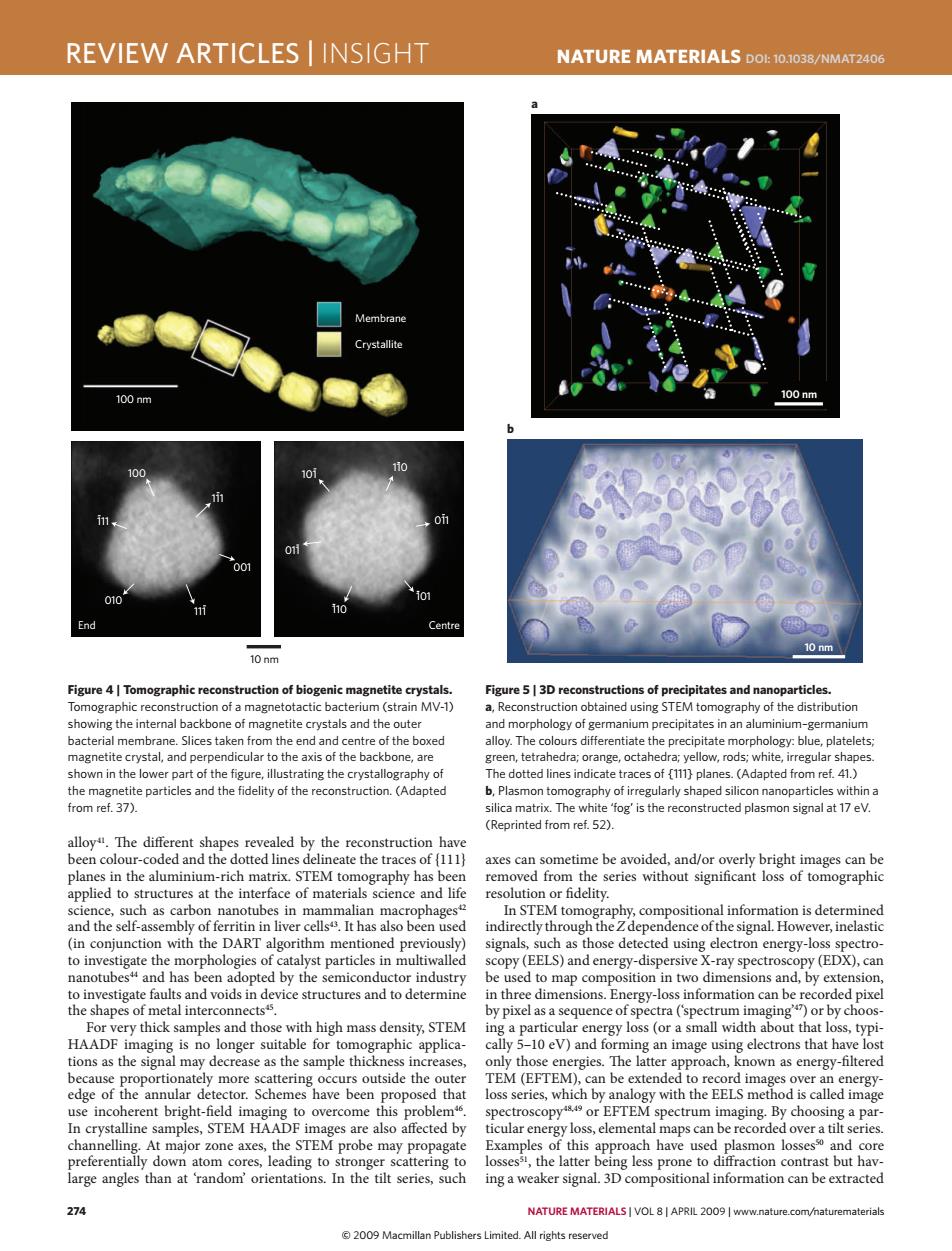
REVIEW ARTICLES INSIGHT NATURE MATERIALS DOL:10.1038/NMAT2406 Membrane Crystallite 100nm 100nm 10i 10 0 001 110 End Centre 10 nm 10 nm Figure 4 Tomographic reconstruction of biogenic magnetite crystals Figure 5|3D reconstructions of precipitates and nanoparticles. Tomographic reconstruction of a magnetotactic bacterium(strain MV-1) a,Reconstruction obtained using STEM tomography of the distribution showing the internal backbone of magnetite crystals and the outer and morphology of germanium precipitates in an aluminium-germanium bacterial membrane.Slices taken from the end and centre of the boxed alloy.The colours differentiate the precipitate morphology:blue,platelets; magnetite crystal,and perpendicular to the axis of the backbone,are green,tetrahedra;orange,octahedra;yellow,rods;white,irregular shapes. shown in the lower part of the figure,illustrating the crystallography of The dotted lines indicate traces of {111}planes.(Adapted from ref.41.) the magnetite particles and the fidelity of the reconstruction.(Adapted b,Plasmon tomography of irregularly shaped silicon nanoparticles within a from ref.37). silica matrix.The white 'fog'is the reconstructed plasmon signal at 17 eV. (Reprinted from ref.52). alloy".The different shapes revealed by the reconstruction have been colour-coded and the dotted lines delineate the traces of {111} axes can sometime be avoided,and/or overly bright images can be planes in the aluminium-rich matrix.STEM tomography has been removed from the series without significant loss of tomographic applied to structures at the interface of materials science and life resolution or fidelity. science,such as carbon nanotubes in mammalian macrophages In STEM tomography,compositional information is determined and the self-assembly of ferritin in liver cells4.It has also been used indirectly through the 2 dependence of the signal.However,inelastic (in conjunction with the DART algorithm mentioned previously) signals,such as those detected using electron energy-loss spectro- to investigate the morphologies of catalyst particles in multiwalled scopy(EELS)and energy-dispersive X-ray spectroscopy(EDX),can nanotubes"and has been adopted by the semiconductor industry be used to map composition in two dimensions and,by extension, to investigate faults and voids in device structures and to determine in three dimensions.Energy-loss information can be recorded pixel the shapes of metal interconnects 5. by pixel as a sequence of spectra ('spectrum imaging)or by choos- For very thick samples and those with high mass density,STEM ing a particular energy loss(or a small width about that loss,typi- HAADF imaging is no longer suitable for tomographic applica- cally 5-10 eV)and forming an image using electrons that have lost tions as the signal may decrease as the sample thickness increases, only those energies.The latter approach,known as energy-filtered because proportionately more scattering occurs outside the outer TEM(EFTEM),can be extended to record images over an energy- edge of the annular detector.Schemes have been proposed that loss series,which by analogy with the EELS method is called image use incoherent bright-field imaging to overcome this problem. spectroscopy4 or EFTEM spectrum imaging.By choosing a par- In crystalline samples,STEM HAADF images are also affected by ticular energy loss,elemental maps can be recorded over a tilt series. channelling.At major zone axes,the STEM probe may propagate Examples of this approach have used plasmon lossess and core preferentially down atom cores,leading to stronger scattering to lossess,the latter being less prone to diffraction contrast but hav- large angles than at random'orientations.In the tilt series,such ing a weaker signal.3D compositional information can be extracted 274 NATURE MATERIALS VOL 8|APRIL 2009 www.nature.com/naturematerials 2009 Macmillan Publishers Limited.All rights reserved274 nature materials | VOL 8 | APRIL 2009 | www.nature.com/naturematerials review articles | insight NaTure maTerIals doi: 10.1038/nmat2406 alloy41. The different shapes revealed by the reconstruction have been colour-coded and the dotted lines delineate the traces of {111} planes in the aluminium-rich matrix. STEM tomography has been applied to structures at the interface of materials science and life science, such as carbon nanotubes in mammalian macrophages42 and the self-assembly of ferritin in liver cells43. It has also been used (in conjunction with the DART algorithm mentioned previously) to investigate the morphologies of catalyst particles in multiwalled nanotubes44 and has been adopted by the semiconductor industry to investigate faults and voids in device structures and to determine the shapes of metal interconnects45. For very thick samples and those with high mass density, STEM HAADF imaging is no longer suitable for tomographic applications as the signal may decrease as the sample thickness increases, because proportionately more scattering occurs outside the outer edge of the annular detector. Schemes have been proposed that use incoherent bright-field imaging to overcome this problem46. In crystalline samples, STEM HAADF images are also affected by channelling. At major zone axes, the STEM probe may propagate preferentially down atom cores, leading to stronger scattering to large angles than at ‘random’ orientations. In the tilt series, such axes can sometime be avoided, and/or overly bright images can be removed from the series without significant loss of tomographic resolution or fidelity. In STEM tomography, compositional information is determined indirectly through the Z dependence of the signal. However, inelastic signals, such as those detected using electron energy-loss spectroscopy (EELS) and energy-dispersive X-ray spectroscopy (EDX), can be used to map composition in two dimensions and, by extension, in three dimensions. Energy-loss information can be recorded pixel by pixel as a sequence of spectra (‘spectrum imaging’47) or by choosing a particular energy loss (or a small width about that loss, typically 5–10 eV) and forming an image using electrons that have lost only those energies. The latter approach, known as energy-filtered TEM (EFTEM), can be extended to record images over an energyloss series, which by analogy with the EELS method is called image spectroscopy48,49 or EFTEM spectrum imaging. By choosing a particular energy loss, elemental maps can be recorded over a tilt series. Examples of this approach have used plasmon losses50 and core losses51, the latter being less prone to diffraction contrast but having a weaker signal. 3D compositional information can be extracted Figure 4 | Tomographic reconstruction of biogenic magnetite crystals. Tomographic reconstruction of a magnetotactic bacterium (strain MV-1) showing the internal backbone of magnetite crystals and the outer bacterial membrane. Slices taken from the end and centre of the boxed magnetite crystal, and perpendicular to the axis of the backbone, are shown in the lower part of the figure, illustrating the crystallography of the magnetite particles and the fidelity of the reconstruction. (Adapted from ref. 37). Figure 5 | 3D reconstructions of precipitates and nanoparticles. a, Reconstruction obtained using STEM tomography of the distribution and morphology of germanium precipitates in an aluminium–germanium alloy. The colours differentiate the precipitate morphology: blue, platelets; green, tetrahedra; orange, octahedra; yellow, rods; white, irregular shapes. The dotted lines indicate traces of {111} planes. (Adapted from ref. 41.) b, Plasmon tomography of irregularly shaped silicon nanoparticles within a silica matrix. The white ‘fog’ is the reconstructed plasmon signal at 17 eV. (Reprinted from ref. 52). QP 111 111 111 100 010 001 End 110 011 101 011 101 110 Centre 10 nm 100 nm Membrane Crystallite 100 nm 10 nm a b nmat_2406_APR09.indd 274 13/3/09 12:08:33 © 2009 Macmillan Publishers Limited. All rights reserved�