正在加载图片...
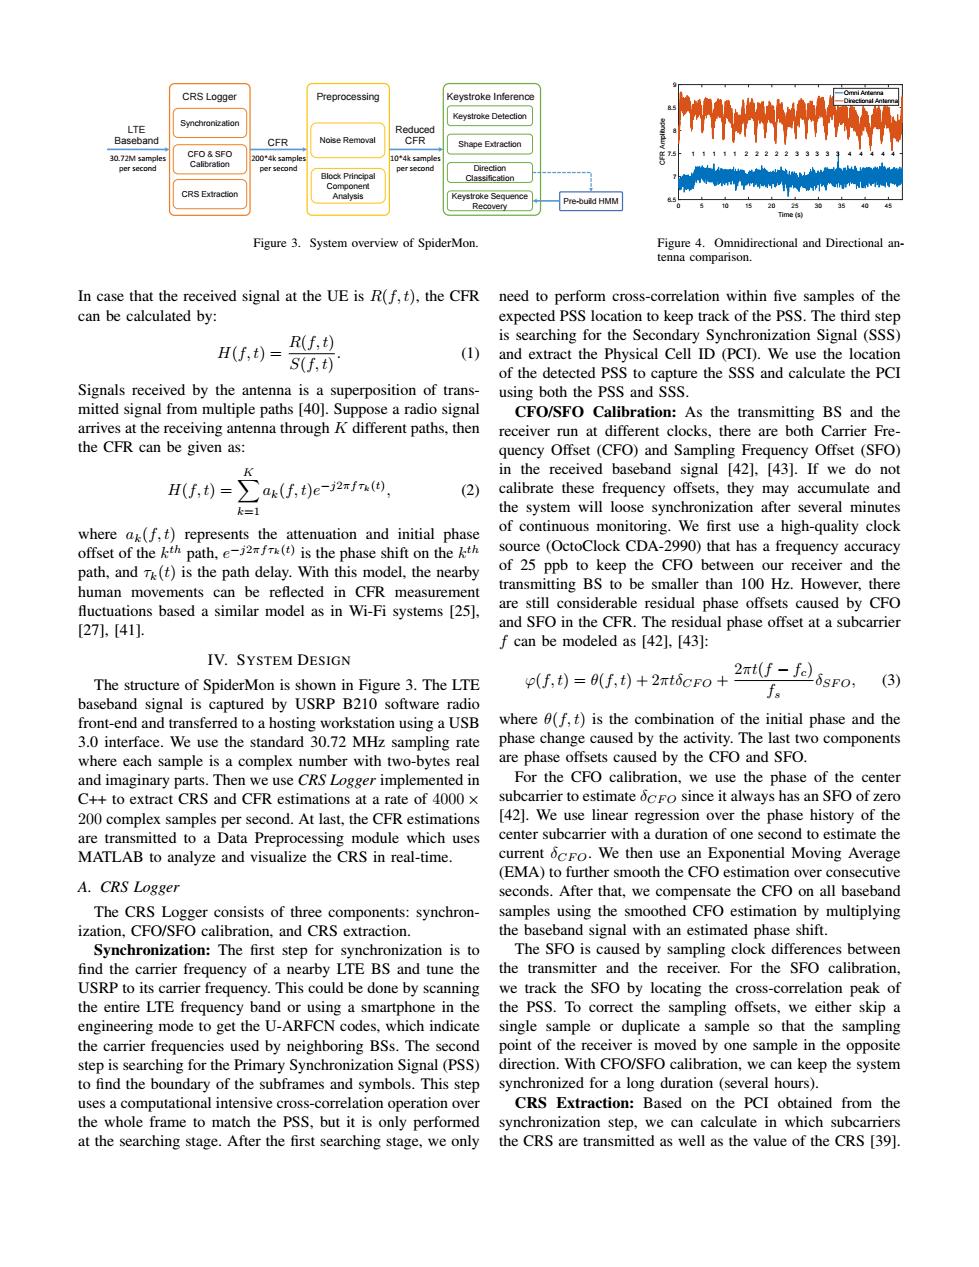
CRS Logger Preprocessing Keystroke Inference Kevstroke Detection LTE Reduced Baseband CFR Noise Removal CFR Shape Extraction 30.72M samples CFO&SFO 200*4k samples 11111222223339 4k samg Calibral山e0 per second per secono Component Analysis Keystroke Sequence Pre-oui时HMM Recovery Figure 3.System overview of SpiderMon. Figure 4.Omnidirectional and Directional an- tenna comparison. In case that the received signal at the UE is R(f,t),the CFR need to perform cross-correlation within five samples of the can be calculated by: expected PSS location to keep track of the PSS.The third step R(f,t) is searching for the Secondary Synchronization Signal(SSS) H(f.t)=s(f.t) (1)and extract the Physical Cell ID (PCD).We use the location of the detected PSS to capture the SSS and calculate the PCI Signals received by the antenna is a superposition of trans- using both the PSS and SSS. mitted signal from multiple paths [40].Suppose a radio signal CFO/SFO Calibration:As the transmitting BS and the arrives at the receiving antenna through k different paths.then receiver run at different clocks,there are both Carrier Fre- the CFR can be given as: quency Offset(CFO)and Sampling Frequency Offset(SFO) in the received baseband signal [42].[43].If we do not H(f,t)= ∑as(f,t)e-2f, (2) calibrate these frequency offsets,they may accumulate and k=1 the system will loose synchronization after several minutes where a(f,t)represents the attenuation and initial phase of continuous monitoring.We first use a high-quality clock offset of the kth path,e()is the phase shift on the kth source (OctoClock CDA-2990)that has a frequency accuracy path,and T(t)is the path delay.With this model,the nearby of 25 ppb to keep the CFO between our receiver and the human movements can be reflected in CFR measurement transmitting BS to be smaller than 100 Hz.However,there fluctuations based a similar model as in Wi-Fi systems [25], are still considerable residual phase offsets caused by CFO [271,[41]. and SFO in the CFR.The residual phase offset at a subcarrier f can be modeled as [42].[43]: IV.SYSTEM DESIGN The structure of SpiderMon is shown in Figure 3.The LTE (f,t)=0(f,t)+2nt6cFo 2rtf-f拉6sro, (3) baseband signal is captured by USRP B210 software radio front-end and transferred to a hosting workstation using a USB where 0(f,t)is the combination of the initial phase and the 3.0 interface.We use the standard 30.72 MHz sampling rate phase change caused by the activity.The last two components where each sample is a complex number with two-bytes real are phase offsets caused by the CFO and SFO. and imaginary parts.Then we use CRS Logger implemented in For the CFO calibration,we use the phase of the center C++to extract CRS and CFR estimations at a rate of 4000 x subcarrier to estimate ocFo since it always has an SFO of zero 200 complex samples per second.At last,the CFR estimations [42].We use linear regression over the phase history of the are transmitted to a Data Preprocessing module which uses center subcarrier with a duration of one second to estimate the MATLAB to analyze and visualize the CRS in real-time. current cFo.We then use an Exponential Moving Average (EMA)to further smooth the CFO estimation over consecutive A.CRS Logger seconds.After that,we compensate the CFO on all baseband The CRS Logger consists of three components:synchron- samples using the smoothed CFO estimation by multiplying ization,CFO/SFO calibration.and CRS extraction. the baseband signal with an estimated phase shift. Synchronization:The first step for synchronization is to The SFO is caused by sampling clock differences between find the carrier frequency of a nearby LTE BS and tune the the transmitter and the receiver.For the SFO calibration. USRP to its carrier frequency.This could be done by scanning we track the SFO by locating the cross-correlation peak of the entire LTE frequency band or using a smartphone in the the PSS.To correct the sampling offsets,we either skip a engineering mode to get the U-ARFCN codes,which indicate single sample or duplicate a sample so that the sampling the carrier frequencies used by neighboring BSs.The second point of the receiver is moved by one sample in the opposite step is searching for the Primary Synchronization Signal(PSS) direction.With CFO/SFO calibration,we can keep the system to find the boundary of the subframes and symbols.This step synchronized for a long duration (several hours). uses a computational intensive cross-correlation operation over CRS Extraction:Based on the PCI obtained from the the whole frame to match the PSS,but it is only performed synchronization step,we can calculate in which subcarriers at the searching stage.After the first searching stage,we only the CRS are transmitted as well as the value of the CRS [39].Synchronization CFO & SFO Calibration CRS Extraction CRS Logger CFR LTE Baseband Noise Removal Block Principal Component Analysis Preprocessing Keystroke Detection Shape Extraction Keystroke Sequence Recovery Keystroke Inference 30.72M samples per second 200*4k samples per second 10*4k samples per second Reduced CFR Direction Classification Pre-build HMM Figure 3. System overview of SpiderMon. 0 5 10 15 20 25 30 35 40 45 Time (s) 6.5 7 7.5 8 8.5 9 CFR Amplitude 1 1 1 11 2 2222 3 33 33 4 4 4 44 Omni Antenna Directional Antenna Figure 4. Omnidirectional and Directional antenna comparison. In case that the received signal at the UE is R(f, t), the CFR can be calculated by: H(f, t) = R(f, t) S(f, t) . (1) Signals received by the antenna is a superposition of transmitted signal from multiple paths [40]. Suppose a radio signal arrives at the receiving antenna through K different paths, then the CFR can be given as: H(f, t) = X K k=1 ak(f, t)e −j2πf τk(t) , (2) where ak(f, t) represents the attenuation and initial phase offset of the k th path, e −j2πf τk(t) is the phase shift on the k th path, and τk(t) is the path delay. With this model, the nearby human movements can be reflected in CFR measurement fluctuations based a similar model as in Wi-Fi systems [25], [27], [41]. IV. SYSTEM DESIGN The structure of SpiderMon is shown in Figure 3. The LTE baseband signal is captured by USRP B210 software radio front-end and transferred to a hosting workstation using a USB 3.0 interface. We use the standard 30.72 MHz sampling rate where each sample is a complex number with two-bytes real and imaginary parts. Then we use CRS Logger implemented in C++ to extract CRS and CFR estimations at a rate of 4000 × 200 complex samples per second. At last, the CFR estimations are transmitted to a Data Preprocessing module which uses MATLAB to analyze and visualize the CRS in real-time. A. CRS Logger The CRS Logger consists of three components: synchronization, CFO/SFO calibration, and CRS extraction. Synchronization: The first step for synchronization is to find the carrier frequency of a nearby LTE BS and tune the USRP to its carrier frequency. This could be done by scanning the entire LTE frequency band or using a smartphone in the engineering mode to get the U-ARFCN codes, which indicate the carrier frequencies used by neighboring BSs. The second step is searching for the Primary Synchronization Signal (PSS) to find the boundary of the subframes and symbols. This step uses a computational intensive cross-correlation operation over the whole frame to match the PSS, but it is only performed at the searching stage. After the first searching stage, we only need to perform cross-correlation within five samples of the expected PSS location to keep track of the PSS. The third step is searching for the Secondary Synchronization Signal (SSS) and extract the Physical Cell ID (PCI). We use the location of the detected PSS to capture the SSS and calculate the PCI using both the PSS and SSS. CFO/SFO Calibration: As the transmitting BS and the receiver run at different clocks, there are both Carrier Frequency Offset (CFO) and Sampling Frequency Offset (SFO) in the received baseband signal [42], [43]. If we do not calibrate these frequency offsets, they may accumulate and the system will loose synchronization after several minutes of continuous monitoring. We first use a high-quality clock source (OctoClock CDA-2990) that has a frequency accuracy of 25 ppb to keep the CFO between our receiver and the transmitting BS to be smaller than 100 Hz. However, there are still considerable residual phase offsets caused by CFO and SFO in the CFR. The residual phase offset at a subcarrier f can be modeled as [42], [43]: ϕ(f, t) = θ(f, t) + 2πtδCF O + 2πt(f − fc) fs δSF O, (3) where θ(f, t) is the combination of the initial phase and the phase change caused by the activity. The last two components are phase offsets caused by the CFO and SFO. For the CFO calibration, we use the phase of the center subcarrier to estimate δCF O since it always has an SFO of zero [42]. We use linear regression over the phase history of the center subcarrier with a duration of one second to estimate the current δCF O. We then use an Exponential Moving Average (EMA) to further smooth the CFO estimation over consecutive seconds. After that, we compensate the CFO on all baseband samples using the smoothed CFO estimation by multiplying the baseband signal with an estimated phase shift. The SFO is caused by sampling clock differences between the transmitter and the receiver. For the SFO calibration, we track the SFO by locating the cross-correlation peak of the PSS. To correct the sampling offsets, we either skip a single sample or duplicate a sample so that the sampling point of the receiver is moved by one sample in the opposite direction. With CFO/SFO calibration, we can keep the system synchronized for a long duration (several hours). CRS Extraction: Based on the PCI obtained from the synchronization step, we can calculate in which subcarriers the CRS are transmitted as well as the value of the CRS [39]