正在加载图片...

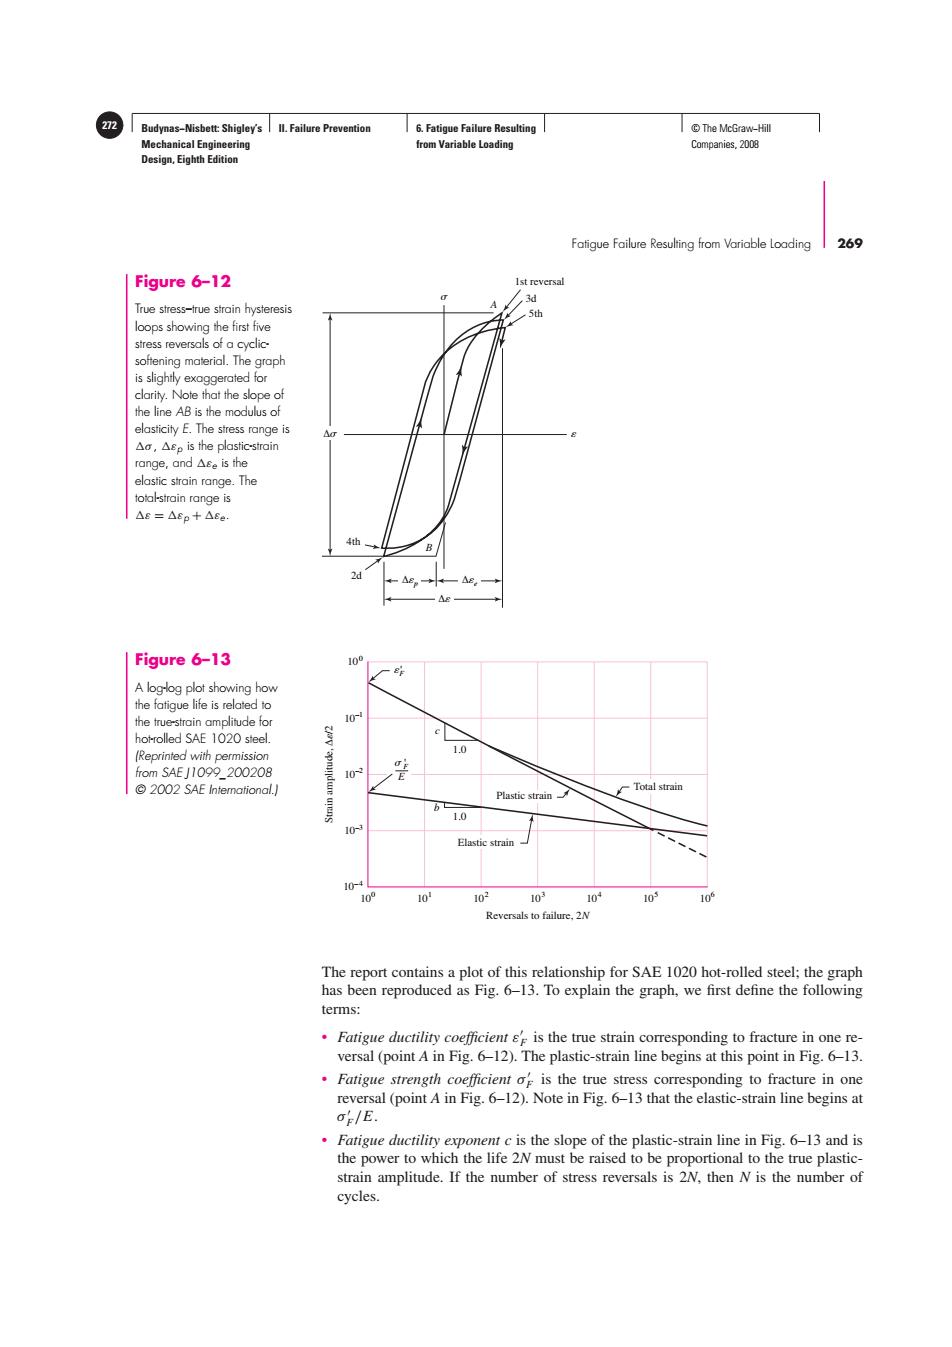
Budynas-Nisbett:Shigley's ll.Failure Prevention 6.Fatigue Failure Resulting ©The McGraw-Hil Mechanical Engineering from Variable Loading Companies,2008 Design,Eighth Edition Fatigue Failure Resulting from Variable Loading 269 Figure 6-12 Ist reversal ,3d True stress-true strain hysteresis .5th loops showing the first five stress reversals of a cyclic softening material.The graph is slightly exaggerated for clarity.Note that the slope of the line AB is the modulus of elasticity E.The stress range is △a,△ep is the plastic-strain range,.and△Se is the elastic strain range.The total-strain range is △g=△Ep+△Ee Figure 6-13 o A loglog plot showing how the fatigue life is related to the true-strain amplitude for 10 hot-rolled SAE 1020 steel. (Reprinted with permission 1.0 from SAE J1099_200208 0N 2002 SAE Intemational.] Plastic strain Total strain 1.0 10 Elastic strain 10 10 10 102 103 104 103 10 Reversals to failure,2N The report contains a plot of this relationship for SAE 1020 hot-rolled steel:the graph has been reproduced as Fig.6-13.To explain the graph,we first define the following terms: Fatigue ductility coefficient s is the true strain corresponding to fracture in one re- versal (point A in Fig.6-12).The plastic-strain line begins at this point in Fig.6-13. Fatigue strength coefficient of is the true stress corresponding to fracture in one reversal (point A in Fig.6-12).Note in Fig.6-13 that the elastic-strain line begins at o/E. Fatigue ductility exponent c is the slope of the plastic-strain line in Fig.6-13 and is the power to which the life 2N must be raised to be proportional to the true plastic- strain amplitude.If the number of stress reversals is 2N,then N is the number of cycles.Budynas−Nisbett: Shigley’s Mechanical Engineering Design, Eighth Edition II. Failure Prevention 6. Fatigue Failure Resulting from Variable Loading 272 © The McGraw−Hill Companies, 2008 Fatigue Failure Resulting from Variable Loading 269 4th 2d 1st reversal 3d 5th A B Δ Δp Δe Δ Figure 6–12 True stress–true strain hysteresis loops showing the first five stress reversals of a cyclicsoftening material. The graph is slightly exaggerated for clarity. Note that the slope of the line AB is the modulus of elasticity E. The stress range is σ , εp is the plastic-strain range, and εe is the elastic strain range. The total-strain range is ε = εp + εe. The report contains a plot of this relationship for SAE 1020 hot-rolled steel; the graph has been reproduced as Fig. 6–13. To explain the graph, we first define the following terms: • Fatigue ductility coefficient ε F is the true strain corresponding to fracture in one reversal (point A in Fig. 6–12). The plastic-strain line begins at this point in Fig. 6–13. • Fatigue strength coefficient σ F is the true stress corresponding to fracture in one reversal (point A in Fig. 6–12). Note in Fig. 6–13 that the elastic-strain line begins at σ F /E. • Fatigue ductility exponent c is the slope of the plastic-strain line in Fig. 6–13 and is the power to which the life 2N must be raised to be proportional to the true plasticstrain amplitude. If the number of stress reversals is 2N, then N is the number of cycles. 100 10–4 10–3 10–2 10–1 100 101 102 103 104 105 106 Reversals to failure, 2N Strain amplitude, Δ/2 ' F c 1.0 b 1.0 ' F E Total strain Plastic strain Elastic strain Figure 6–13 A log-log plot showing how the fatigue life is related to the true-strain amplitude for hot-rolled SAE 1020 steel. (Reprinted with permission from SAE J1099_200208 © 2002 SAE International.)������������������