正在加载图片...

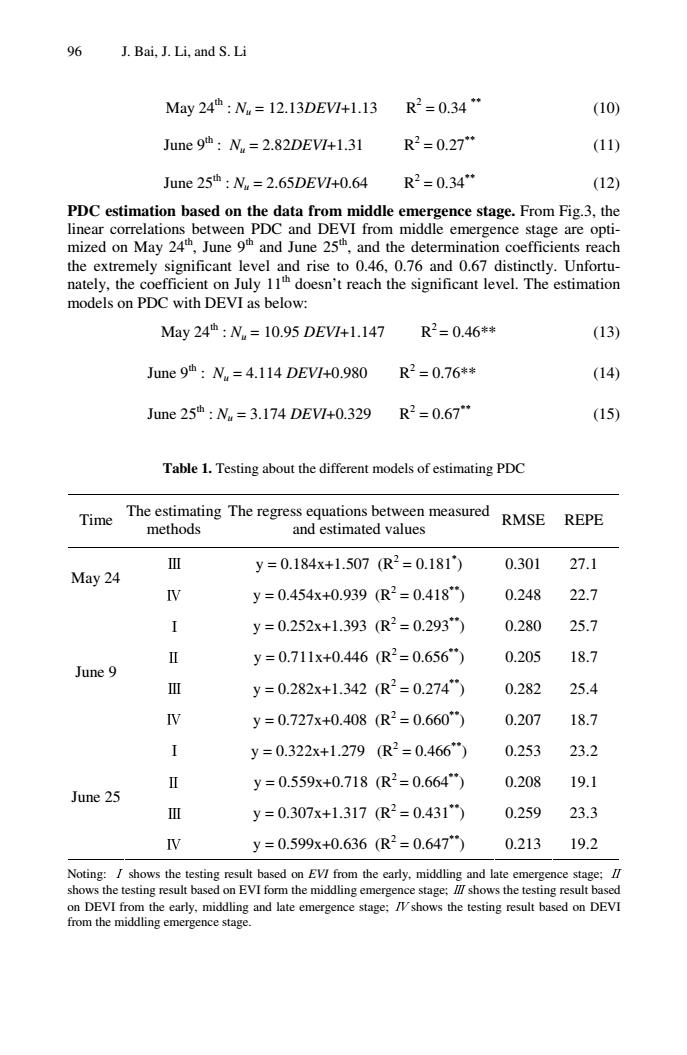
96 J.Bai.J.Li,and S.Li May24:N=12.13DEVM+1.13 R2=0.34 (10) June 9th:N =2.82DEV1+1.31 R2=0.27 (11) June 25th N.2.65DEV/+0.64 R2=0.34 (12) PDC estimation based on the data from middle c n PDC and DEvI from .From Fig,the mized on May Juneand and the dete th extremel leve co046 0.76 Unfortu esn't reach the significan May24:N,=10.95DEV+l.147 R2=0.46* (13) June9h:N=4.114DEV7+0.980 R2=0.76* (14 June25:N.=3.174DEV7+0.329 R2=0.67 (15) Table 1.Testing about the different models of estimating PDC Time The estimating The regress equations between measured RMSE methods REPE and estimated values y=0.184x+1.507R2=0.181 0.301 27.1 May 24 y=0.454x+0.939(R2=0.418 0.248 22.7 I y=0.252x+1.393(R2=0.293" 0.280 25.7 白 y=0.711x+0.446(R2=0.656” 0.205 18.7 Ⅲ y=0.282x+1.342(R2=0.274) 0.282 25.4 N y=0.727x+0.408(R2=0.660” 0.207 18.7 y=0.322x+1.279(R2=0.466 0.253 23.2 y=0.559x+0.718(R2=0.664” 0.208 19.1 June 25 y=0.307x+1.317R2=0.431 0.259 23.3 y=0.599x+0.636(R2=0.647” 0.213 19.2 Noting:/shows the testing result based on EVI from the early,middling and late emergence stage: shows the testing result based on EVI form the middling emergence stage:I shows the testing result base .midling and late emrgence stage:shows the testing based DEV 96 J. Bai, J. Li, and S. Li May 24th : Nu = 12.13DEVI+1.13 R2 = 0.34 ** (10) June 9th : Nu = 2.82DEVI+1.31 R2 = 0.27** (11) June 25th : Nu = 2.65DEVI+0.64 R2 = 0.34** (12) PDC estimation based on the data from middle emergence stage. From Fig.3, the linear correlations between PDC and DEVI from middle emergence stage are optimized on May 24th, June 9th and June 25th, and the determination coefficients reach the extremely significant level and rise to 0.46, 0.76 and 0.67 distinctly. Unfortunately, the coefficient on July 11th doesn’t reach the significant level. The estimation models on PDC with DEVI as below: May 24th : Nu = 10.95 DEVI+1.147 R2 = 0.46** (13) June 9th : Nu = 4.114 DEVI+0.980 R2 = 0.76** (14) June 25th : Nu = 3.174 DEVI+0.329 R2 = 0.67** (15) Table 1. Testing about the different models of estimating PDC Time The estimating methods The regress equations between measured and estimated values RMSE REPE Ⅲ y = 0.184x+1.507 (R2 = 0.181* ) 0.301 27.1 May 24 Ⅳ y = 0.454x+0.939 (R2 = 0.418**) 0.248 22.7 Ⅰ y = 0.252x+1.393 (R2 = 0.293**) 0.280 25.7 Ⅱ y = 0.711x+0.446 (R2 = 0.656**) 0.205 18.7 Ⅲ y = 0.282x+1.342 (R2 = 0.274**) 0.282 25.4 June 9 Ⅳ y = 0.727x+0.408 (R2 = 0.660**) 0.207 18.7 Ⅰ y = 0.322x+1.279 (R2 = 0.466**) 0.253 23.2 Ⅱ y = 0.559x+0.718 (R2 = 0.664**) 0.208 19.1 Ⅲ y = 0.307x+1.317 (R2 = 0.431**) 0.259 23.3 June 25 Ⅳ y = 0.599x+0.636 (R2 = 0.647**) 0.213 19.2 Noting: Ⅰ shows the testing result based on EVI from the early, middling and late emergence stage; Ⅱ shows the testing result based on EVI form the middling emergence stage; Ⅲ shows the testing result based on DEVI from the early, middling and late emergence stage; Ⅳ shows the testing result based on DEVI from the middling emergence stage