正在加载图片...
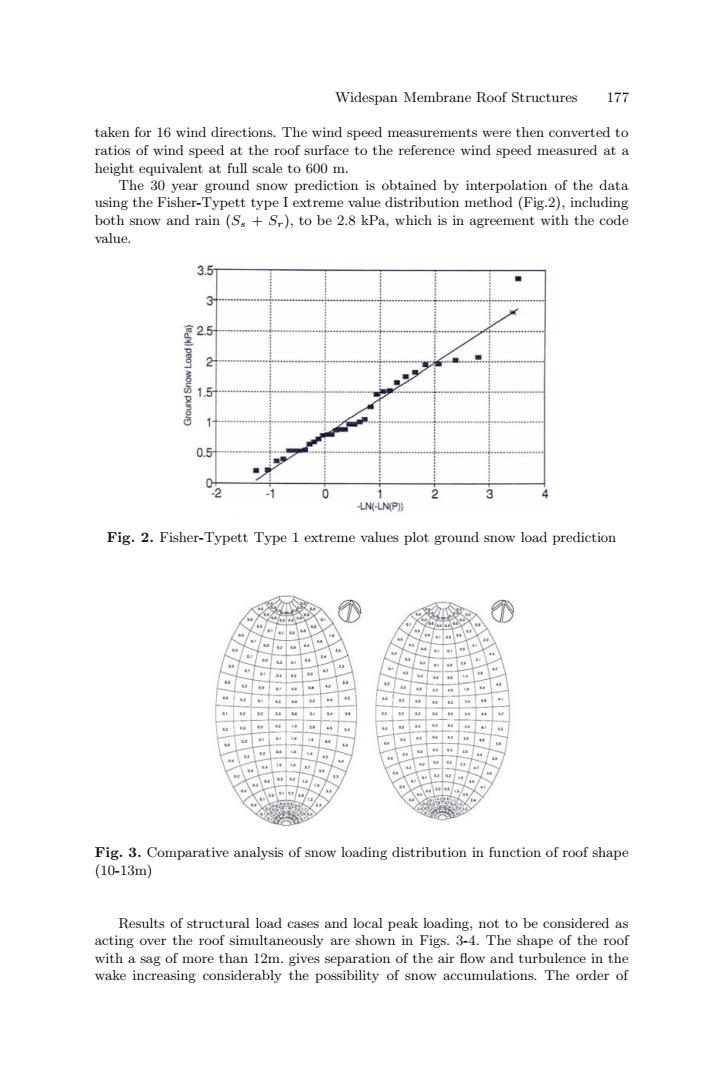
Widespan Membrane Roof Structures 177 taken for 16 wind directions.The wind speed measurements were then converted to ratios of wind speed at the roof surface to the reference wind speed measured at a height equivalent at full scale to 600 m. The 30 year ground snow prediction is obtained by interpolation of the data using the Fisher-Typett type I extreme value distribution method (Fig.2),including both snow and rain (S.+S,),to be 2.8 kPa,which is in agreement with the code value. 3.5 2.5 1.5 0.5 LN(-LN(P)) Fig.2.Fisher-Typett Type 1 extreme values plot ground snow load prediction Fig.3.Comparative analysis of snow loading distribution in function of roof shape (10-13m) Results of structural load cases and local peak loading,not to be considered as acting over the roof simultaneously are shown in Figs.3-4.The shape of the roof with a sag of more than 12m.gives separation of the air flow and turbulence in the wake increasing considerably the possibility of snow accumulations.The order ofWidespan Membrane Roof Structures 177 taken for 16 wind directions. The wind speed measurements were then converted to ratios of wind speed at the roof surface to the reference wind speed measured at a height equivalent at full scale to 600 m. The 30 year ground snow prediction is obtained by interpolation of the data using the Fisher-Typett type I extreme value distribution method (Fig.2), including both snow and rain (Ss + Sr), to be 2.8 kPa, which is in agreement with the code value. Fig. 2. Fisher-Typett Type 1 extreme values plot ground snow load prediction Fig. 3. Comparative analysis of snow loading distribution in function of roof shape (10-13m) Results of structural load cases and local peak loading, not to be considered as acting over the roof simultaneously are shown in Figs. 3-4. The shape of the roof with a sag of more than 12m. gives separation of the air flow and turbulence in the wake increasing considerably the possibility of snow accumulations. The order of