正在加载图片...
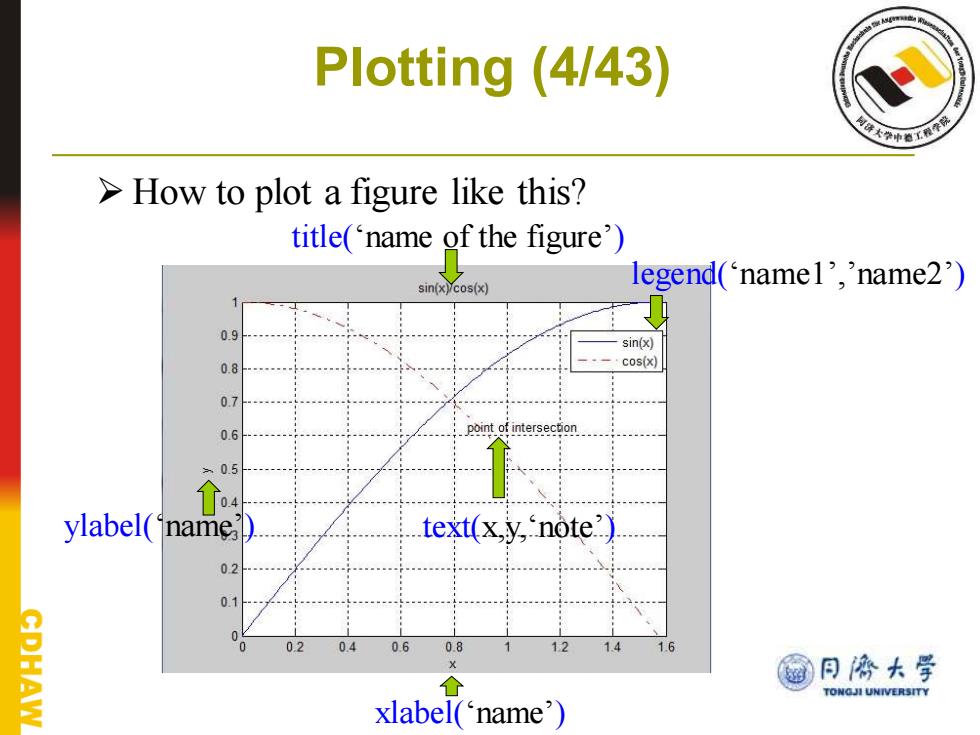
Plotting (4/43) >How to plot a figure like this? title(name of the figure') sin(x)cos(x) legend(namel','name2') 0.9 sin(x) 0.8 cos(x) 0.7 0.6 point of intersection 0.5 4 ylabel(name text(xy,note?) 02 CPHAW 0 0.2 0.4 0.6 0.8 12 1.6 @月停大学 TONGJI UNIVERSITY xlabel(name)Plotting (4/43) ➢ How to plot a figure like this? title(‘name of the figure’) legend(‘name1’,’name2’) xlabel(‘name’) ylabel(‘name’) text(x,y,‘note’)