正在加载图片...
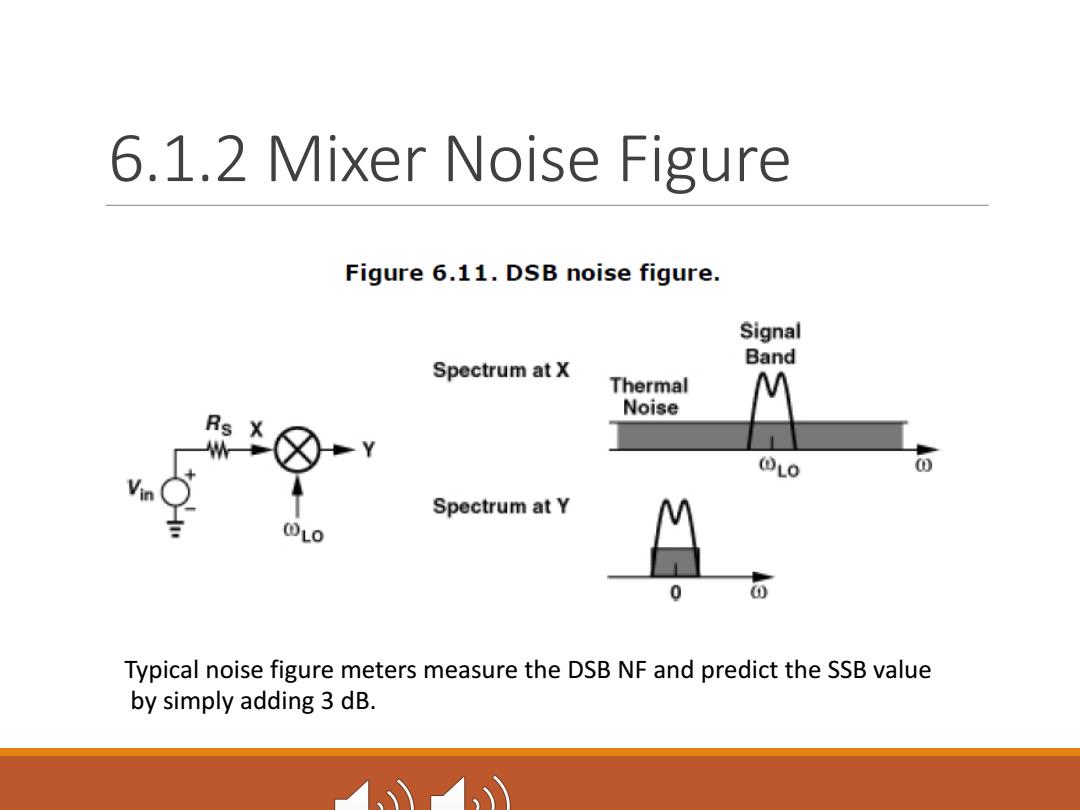
6.1.2 Mixer Noise Figure Figure 6.11.DSB noise figure. Signal Band Spectrum at X Thermal M Noise 0L0 0 Spectrum at Y 0 Typical noise figure meters measure the DSB NF and predict the SSB value by simply adding 3 dB.6.1.2 Mixer Noise Figure Typical noise figure meters measure the DSB NF and predict the SSB value by simply adding 3 dB