正在加载图片...

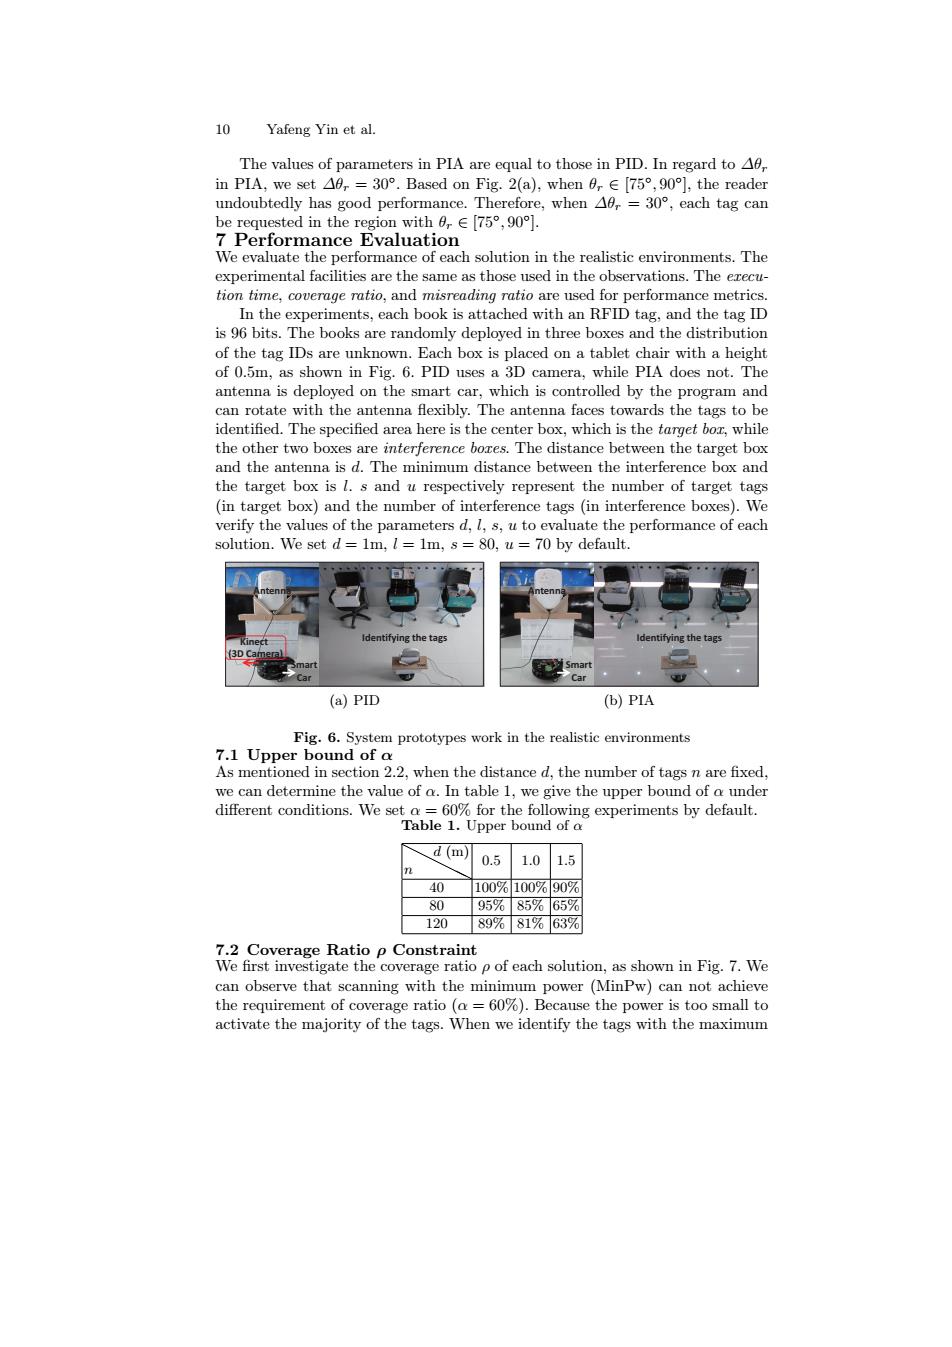
10 Yafeng Yin et al. The values of parameters in PIA are equal to those in PID.In regard to Ad, in PIA,we set△9,=30°.Based on Fig.2(a),when0r∈[75°,90],the reader undoubtedly has good performance.Therefore,when A0,=30,each tag can be requested in the region with,∈[75°,90]. 7 Performance Evaluation We evaluate the performance of each solution in the realistic environments.The experimental facilities are the same as those used in the observations.The execu- tion time,coverage ratio,and misreading ratio are used for performance metrics. In the experiments,each book is attached with an RFID tag,and the tag ID is 96 bits.The books are randomly deployed in three boxes and the distribution of the tag IDs are unknown.Each box is placed on a tablet chair with a height of 0.5m,as shown in Fig.6.PID uses a 3D camera,while PIA does not.The antenna is deployed on the smart car,which is controlled by the program and can rotate with the antenna flexibly.The antenna faces towards the tags to be identified.The specified area here is the center box,which is the target bor,while the other two boxes are interference bores.The distance between the target box and the antenna is d.The minimum distance between the interference box and the target box is l.s and u respectively represent the number of target tags (in target box)and the number of interference tags (in interference boxes).We verify the values of the parameters d,l,s,u to evaluate the performance of each solution.We set d=1m.I=1m,s=80,u=70 by default. Ing the tags 3D (a)PID (b)PIA Fig.6.System prototypes work in the realistic environments 7.1 Upper bound of o As mentioned in section 2.2,when the distance d,the number of tags n are fixed. we can determine the value of a.In table 1,we give the upper bound of o under different conditions.We set a=60%for the following experiments by default. Table 1.Upper bound of o d (m) 0.5 1.0 1.5 40 100%1100%90% 80 95%85%65% 120 89%81%63% 7.2 Coverage Ratio p Constraint We first investigate the coverage ratio p of each solution,as shown in Fig.7.We can observe that scanning with the minimum power (MinPw)can not achieve the requirement of coverage ratio (a =60%).Because the power is too small to activate the majority of the tags.When we identify the tags with the maximum10 Yafeng Yin et al. The values of parameters in PIA are equal to those in PID. In regard to ∆θr in PIA, we set ∆θr = 30◦ . Based on Fig. 2(a), when θr ∈ [75◦ , 90◦ ], the reader undoubtedly has good performance. Therefore, when ∆θr = 30◦ , each tag can be requested in the region with θr ∈ [75◦ , 90◦ ]. 7 Performance Evaluation We evaluate the performance of each solution in the realistic environments. The experimental facilities are the same as those used in the observations. The execution time, coverage ratio, and misreading ratio are used for performance metrics. In the experiments, each book is attached with an RFID tag, and the tag ID is 96 bits. The books are randomly deployed in three boxes and the distribution of the tag IDs are unknown. Each box is placed on a tablet chair with a height of 0.5m, as shown in Fig. 6. PID uses a 3D camera, while PIA does not. The antenna is deployed on the smart car, which is controlled by the program and can rotate with the antenna flexibly. The antenna faces towards the tags to be identified. The specified area here is the center box, which is the target box, while the other two boxes are interference boxes. The distance between the target box and the antenna is d. The minimum distance between the interference box and the target box is l. s and u respectively represent the number of target tags (in target box) and the number of interference tags (in interference boxes). We verify the values of the parameters d, l, s, u to evaluate the performance of each solution. We set d = 1m, l = 1m, s = 80, u = 70 by default. Smart Car Kinect (3D Camera) Antenna Identifying the tags (a) PID Smart Car Identifying the tags Antenna (b) PIA Fig. 6. System prototypes work in the realistic environments 7.1 Upper bound of α As mentioned in section 2.2, when the distance d, the number of tags n are fixed, we can determine the value of α. In table 1, we give the upper bound of α under different conditions. We set α = 60% for the following experiments by default. Table 1. Upper bound of α ❍ n ❍❍❍❍ d (m) 0.5 1.0 1.5 40 100% 100% 90% 80 95% 85% 65% 120 89% 81% 63% 7.2 Coverage Ratio ρ Constraint We first investigate the coverage ratio ρ of each solution, as shown in Fig. 7. We can observe that scanning with the minimum power (MinPw) can not achieve the requirement of coverage ratio (α = 60%). Because the power is too small to activate the majority of the tags. When we identify the tags with the maximum