正在加载图片...
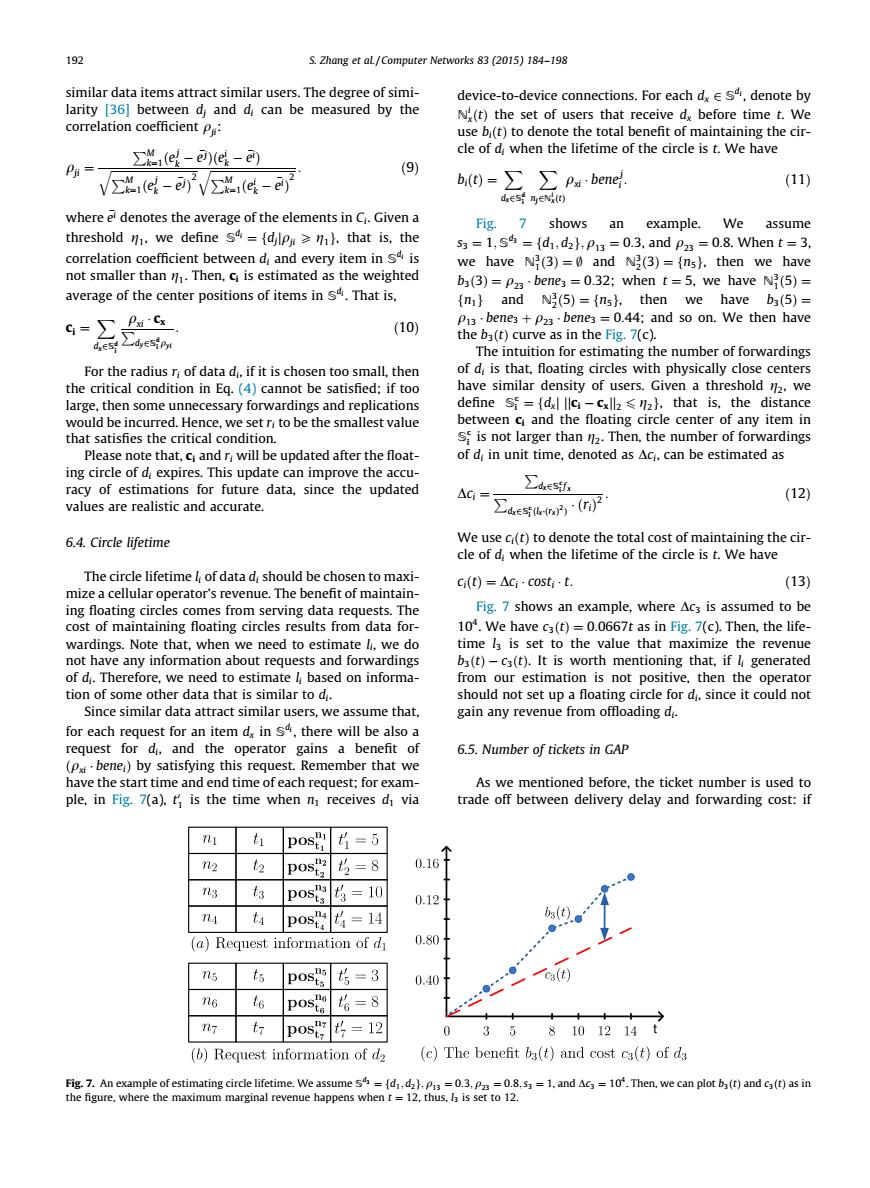
192 S.Zhang et aL /Computer Networks 83 (2015)184-198 similar data items attract similar users.The degree of simi- device-to-device connections.For each dx esa,denote by larity [36]between d and d can be measured by the N(t)the set of users that receive dy before time t.We correlation coefficient P: use bi(t)to denote the total benefit of maintaining the cir- ∑,e-e- cle of d when the lifetime of the circle is t.We have Pi= (9) V∑ae-eV∑a(e-e b()=∑∑Pabene (11) dx∈sn∈( where el denotes the average of the elements in Ci.Given a Fig.7 shows an example.We assume threshold m,we define sd={dilp>m).that is.the s3=1,s4={d1,d2h,p3=0.3.andp23=0.8.When t=3. correlation coefficient between di and every item in sd is we have N(3)=0 and N(3)={ns).then we have not smaller than m.Then,c is estimated as the weighted b3(3)=P23.benes =0.32:when t=5,we have N3(5)= average of the center positions of items in sd.That is, n1} and N3(5)={ns}.then we have b3(5)= 9-TPa·cx P13.benes +P23.benes =0.44;and so on.We then have (10) 4∑4e the b3(t)curve as in the Fig.7(c). The intuition for estimating the number of forwardings For the radius r of data di.if it is chosen too small,then of di is that,floating circles with physically close centers the critical condition in Eq.(4)cannot be satisfied:if too have similar density of users.Given a threshold 2.we large,then some unnecessary forwardings and replications define Sf={dx lc-cxll212).that is,the distance would be incurred.Hence,we set r to be the smallest value between c and the floating circle center of any item in that satisfies the critical condition. S is not larger than 12.Then,the number of forwardings Please note that,c and r will be updated after the float- of di in unit time,denoted as Aci.can be estimated as ing circle of d expires.This update can improve the accu- racy of estimations for future data,since the updated △Ci ∑dke断 (12) values are realistic and accurate. ∑de(T 6.4.Circle lifetime We use ci(t)to denote the total cost of maintaining the cir- cle of d when the lifetime of the circle is t.We have The circle lifetime l of data d,should be chosen to maxi- ci()=△G,cost·t. (13) mize a cellular operator's revenue.The benefit of maintain- ing floating circles comes from serving data requests.The Fig.7 shows an example,where Acs is assumed to be cost of maintaining floating circles results from data for- 104.We have c3(t)=0.0667t as in Fig.7(c).Then,the life- wardings.Note that,when we need to estimate l,we do time I is set to the value that maximize the revenue not have any information about requests and forwardings b3(t)-c3(t).It is worth mentioning that,if generated of d.Therefore,we need to estimate l based on informa- from our estimation is not positive,then the operator tion of some other data that is similar to di. should not set up a floating circle for di,since it could not Since similar data attract similar users,we assume that, gain any revenue from offloading d. for each request for an item dx in s4,there will be also a request for d.and the operator gains a benefit of 6.5.Number of tickets in GAP (P bene)by satisfying this request.Remember that we have the start time and end time of each request;for exam- As we mentioned before,the ticket number is used to ple,in Fig.7(a).t is the time when n receives d via trade off between delivery delay and forwarding cost:if ni =5 7 2 t2 2 p05t t均=8 0.1 3 t3 3 =10 0.12 =14 (a)Request information of d 0.80 ns t=3 0.40 ca(t) 6 6=8 t7 pos 7=12 0 358101214 (b)Request information of d2 (c)The benefit ba(t)and cost ca(t)of da Fig.7.An example of estimating circle lifetime.We assume=(d.dP=0.3.P=0.8.5a=1.and Ac3=10.Then,we can plot ba(t)and ca(t)as in the figure,where the maximum marginal revenue happens when t =12,thus.I is set to 12.similar data items attract similar users. The degree of similarity [36] between dj and di can be measured by the correlation coefficient qji: qji ¼ PM k¼1ðej k ej Þðei k ei Þ ffiffiffiffiffiffiffiffiffiffiffiffiffiffiffiffiffiffiffiffiffiffiffiffiffiffiffiffiffiffiffi PM k¼1ðej k ej Þ 2 q ffiffiffiffiffiffiffiffiffiffiffiffiffiffiffiffiffiffiffiffiffiffiffiffiffiffiffiffiffiffiffi PM k¼1ðei k ei Þ 2 q : ð9Þ where ei denotes the average of the elements in Ci. Given a threshold g1, we define Sdi ¼ fdjjqji P g1g, that is, the correlation coefficient between di and every item in Sdi is not smaller than g1. Then, ci is estimated as the weighted average of the center positions of items in Sdi . That is, ci ¼ X dx2Sd i qxi P cx dy2Sd i qyi : ð10Þ For the radius ri of data di, if it is chosen too small, then the critical condition in Eq. (4) cannot be satisfied; if too large, then some unnecessary forwardings and replications would be incurred. Hence, we set ri to be the smallest value that satisfies the critical condition. Please note that, ci and ri will be updated after the floating circle of di expires. This update can improve the accuracy of estimations for future data, since the updated values are realistic and accurate. 6.4. Circle lifetime The circle lifetime li of data di should be chosen to maximize a cellular operator’s revenue. The benefit of maintaining floating circles comes from serving data requests. The cost of maintaining floating circles results from data forwardings. Note that, when we need to estimate li, we do not have any information about requests and forwardings of di. Therefore, we need to estimate li based on information of some other data that is similar to di. Since similar data attract similar users, we assume that, for each request for an item dx in Sdi , there will be also a request for di, and the operator gains a benefit of ðqxi beneiÞ by satisfying this request. Remember that we have the start time and end time of each request; for example, in Fig. 7(a), t 0 1 is the time when n1 receives d1 via device-to-device connections. For each dx 2 Sdi , denote by Ni xðtÞ the set of users that receive dx before time t. We use biðtÞ to denote the total benefit of maintaining the circle of di when the lifetime of the circle is t. We have biðtÞ ¼ X dx2Sd i X nj2Ni x ðtÞ qxi benej i : ð11Þ Fig. 7 shows an example. We assume s3 ¼ 1; Sd3 ¼ fd1; d2g; q13 ¼ 0:3, and q23 ¼ 0:8. When t ¼ 3, we have N3 1ð3Þ¼; and N3 2ð3Þ¼fn5g, then we have b3ð3Þ ¼ q23 bene3 ¼ 0:32; when t ¼ 5, we have N3 1ð5Þ ¼ fn1g and N3 2ð5Þ¼fn5g, then we have b3ð5Þ ¼ q13 bene3 þ q23 bene3 ¼ 0:44; and so on. We then have the b3ðtÞ curve as in the Fig. 7(c). The intuition for estimating the number of forwardings of di is that, floating circles with physically close centers have similar density of users. Given a threshold g2, we define Sc i ¼ fdxj jjci cxjj2 6 g2g, that is, the distance between ci and the floating circle center of any item in Sc i is not larger than g2. Then, the number of forwardings of di in unit time, denoted as Dci, can be estimated as Dci ¼ P dx2Sc i f x P dx2Sc i ðlxðrx Þ 2Þ ðriÞ 2 : ð12Þ We use ciðtÞ to denote the total cost of maintaining the circle of di when the lifetime of the circle is t. We have ciðtÞ ¼ Dci costi t: ð13Þ Fig. 7 shows an example, where Dc3 is assumed to be 104 . We have c3ðtÞ ¼ 0:0667t as in Fig. 7(c). Then, the lifetime l3 is set to the value that maximize the revenue b3ðtÞ c3ðtÞ. It is worth mentioning that, if li generated from our estimation is not positive, then the operator should not set up a floating circle for di, since it could not gain any revenue from offloading di. 6.5. Number of tickets in GAP As we mentioned before, the ticket number is used to trade off between delivery delay and forwarding cost: if Fig. 7. An example of estimating circle lifetime. We assume Sd3 ¼ fd1; d2g; q13 ¼ 0:3; q23 ¼ 0:8; s3 ¼ 1, and Dc3 ¼ 104 . Then, we can plot b3ðtÞ and c3ðtÞ as in the figure, where the maximum marginal revenue happens when t ¼ 12, thus, l3 is set to 12. 192 S. Zhang et al. / Computer Networks 83 (2015) 184–198�����