正在加载图片...

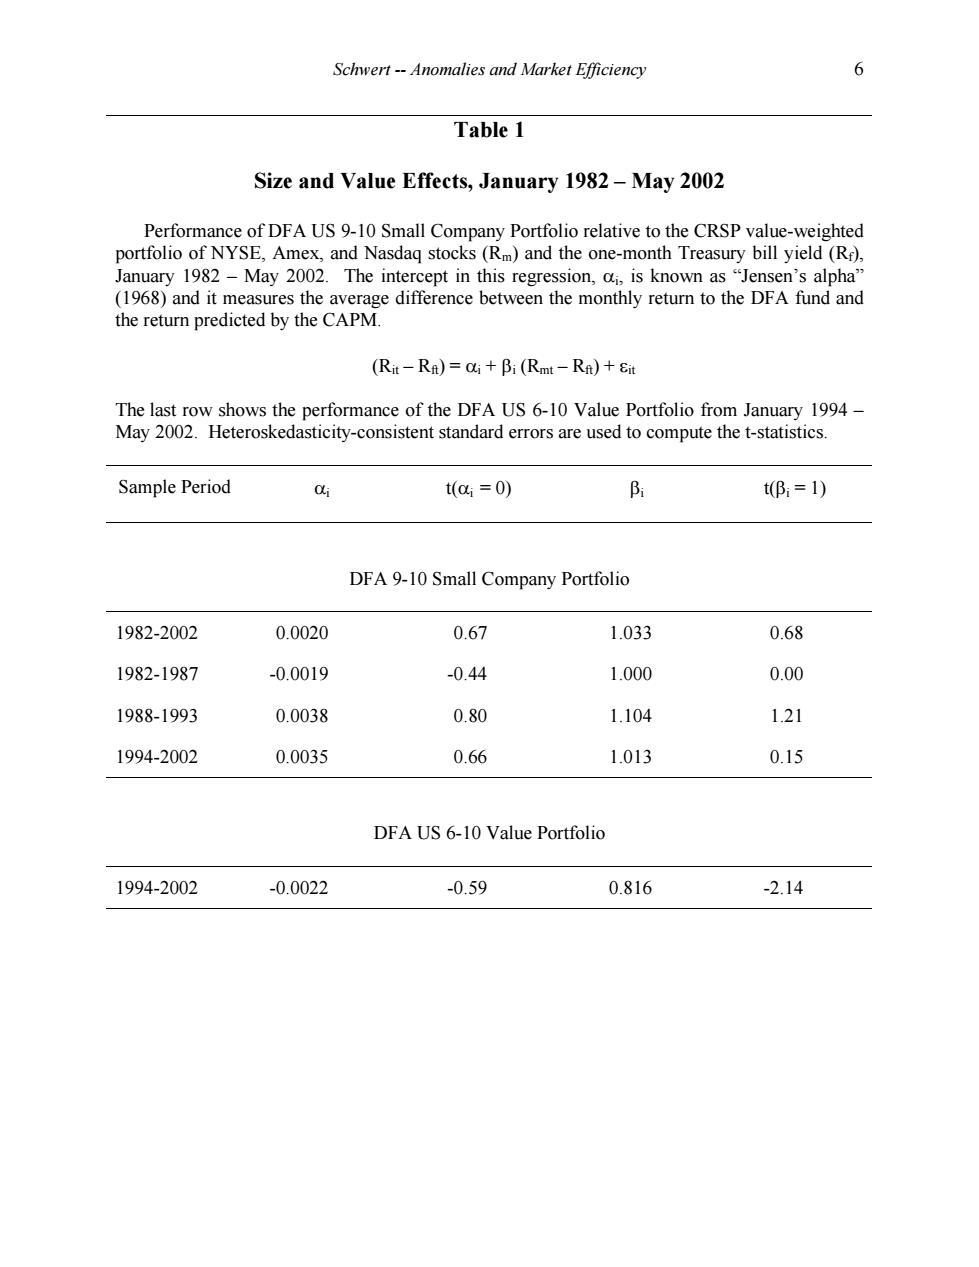
Schwert--Anomalies and Market Efficiency 6 Table 1 Size and Value Effects,January 1982-May 2002 Performance of DFA US 9-10 Small Company Portfolio relative to the CRSP value-weighted portfolio of NYSE,Amex,and Nasdaq stocks(Rm)and the one-month Treasury bill yield(R), January 1982-May 2002.The intercept in this regression,a,is known as "Jensen's alpha" (1968)and it measures the average difference between the monthly return to the DFA fund and the return predicted by the CAPM. (Rit-Ra)=ai+Bi(Rmt-RA)+Sit The last row shows the performance of the DFA US 6-10 Value Portfolio from January 1994- May 2002.Heteroskedasticity-consistent standard errors are used to compute the t-statistics. Sample Period 04 t(0:=0) B tβ:=1) DFA 9-10 Small Company Portfolio 1982-2002 0.0020 0.67 1.033 0.68 1982-1987 -0.0019 -0.44 1.000 0.00 1988-1993 0.0038 0.80 1.104 1.21 1994-2002 0.0035 0.66 1.013 0.15 DFA US 6-10 Value Portfolio 1994-2002 -0.0022 -0.59 0.816 -2.14Schwert -- Anomalies and Market Efficiency 6 Table 1 Size and Value Effects, January 1982 – May 2002 Performance of DFA US 9-10 Small Company Portfolio relative to the CRSP value-weighted portfolio of NYSE, Amex, and Nasdaq stocks (Rm) and the one-month Treasury bill yield (Rf), January 1982 – May 2002. The intercept in this regression, ai , is known as “Jensen’s alpha” (1968) and it measures the average difference between the monthly return to the DFA fund and the return predicted by the CAPM. (Rit – Rft) = ai + bi (Rmt – Rft) + eit The last row shows the performance of the DFA US 6-10 Value Portfolio from January 1994 – May 2002. Heteroskedasticity-consistent standard errors are used to compute the t-statistics. Sample Period ai t(ai = 0) bi t(bi = 1) DFA 9-10 Small Company Portfolio 1982-2002 0.0020 0.67 1.033 0.68 1982-1987 -0.0019 -0.44 1.000 0.00 1988-1993 0.0038 0.80 1.104 1.21 1994-2002 0.0035 0.66 1.013 0.15 DFA US 6-10 Value Portfolio 1994-2002 -0.0022 -0.59 0.816 -2.14