正在加载图片...
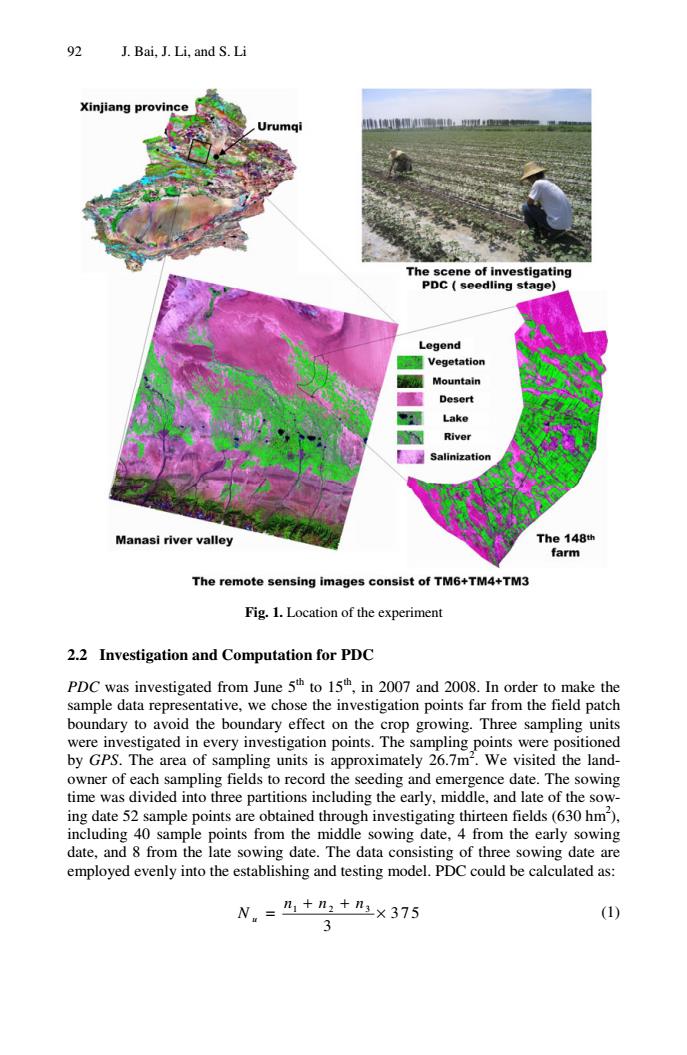
92 J.Bai,J.Li,and S.Li Xinjiang provi ene of investigating ng st Rive alinizati Manasi river valley The The remote sensing images consist of TM6+TM Fig.1.Location of the experiment 2.2 Investigation and Computation for PDC PDC was investigated from June 5th to 15th,in 2007 and 2008.In order to make the sample data sentative.we chose the investigation points far from the field patch on op gro byGPS.The area appro tely owner of each te.The sowing 0 M ce par 0 sample points from the middle sowing date.4 from the early sowing date,and from the late sowing date.The data consisting of three sowing date are employed evenly into the establishing and testing model.PDC could be calculated as: N.=+m,+m×375 (1) 3 92 J. Bai, J. Li, and S. Li Fig. 1. Location of the experiment 2.2 Investigation and Computation for PDC PDC was investigated from June 5th to 15th, in 2007 and 2008. In order to make the sample data representative, we chose the investigation points far from the field patch boundary to avoid the boundary effect on the crop growing. Three sampling units were investigated in every investigation points. The sampling points were positioned by GPS. The area of sampling units is approximately 26.7m2 . We visited the landowner of each sampling fields to record the seeding and emergence date. The sowing time was divided into three partitions including the early, middle, and late of the sowing date 52 sample points are obtained through investigating thirteen fields (630 hm2 ), including 40 sample points from the middle sowing date, 4 from the early sowing date, and 8 from the late sowing date. The data consisting of three sowing date are employed evenly into the establishing and testing model. PDC could be calculated as: 123 375 3 u nn n N + + = × (1)