正在加载图片...
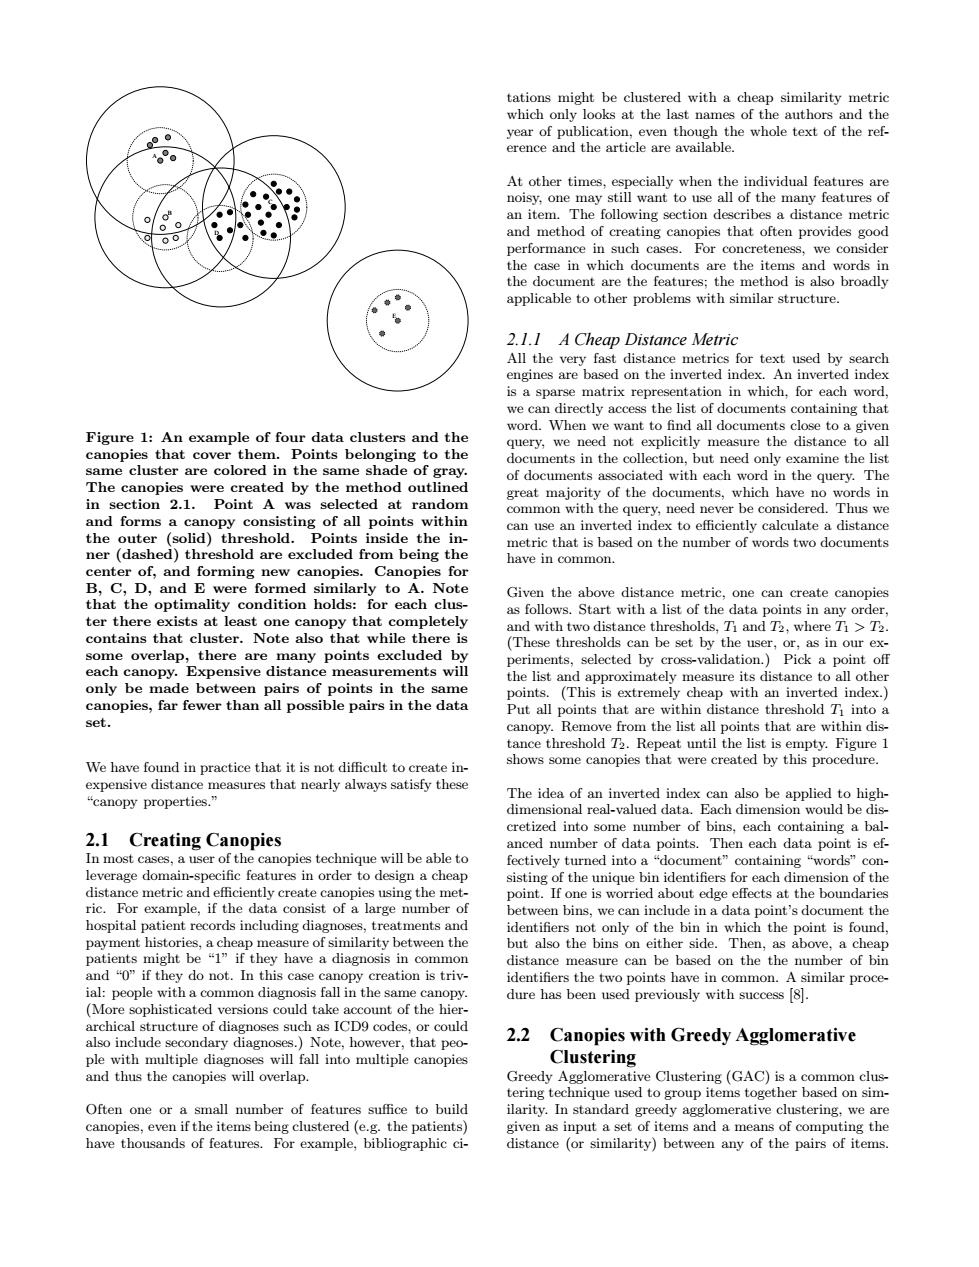
tations might be clustered with a cheap similarity metric which only looks at the last names of the authors and the year of publication,even though the whole text of the ref. erence and the article are available. At other times,especially when the individual features are noisy,one may still want to use all of the many features of an item.The following section describes a distance metric 00 and method of creating canopies that often provides good performance in such cases.For concreteness,we consider the case in which documents are the items and words in the document are the features:the method is also broadly applicable to other problems with similar structure. 2.1.1 A Cheap Distance Metric All the very fast distance metrics for text used by search engines are based on the inverted index.An inverted index is a sparse matrix representation in which,for each word, we can directly access the list of documents containing that word.When we want to find all documents close to a given Figure 1:An example of four data clusters and the query,we need not explicitly measure the distance to all canopies that cover them.Points belonging to the documents in the collection,but need only examine the list same cluster are colored in the same shade of gray. of documents associated with each word in the query.The The canopies were created by the method outlined great majority of the documents,which have no words in in section 2.1.Point A was selected at random common with the query,need never be considered.Thus we and forms a canopy consisting of all points within can use an inverted index to efficiently calculate a distance the outer (solid)threshold.Points inside the in- metric that is based on the number of words two documents ner (dashed)threshold are excluded from being the have in common. center of,and forming new canopies.Canopies for B,C,D,and E were formed similarly to A.Note Given the above distance metric,one can create canopies that the optimality condition holds:for each clus- as follows.Start with a list of the data points in any order, ter there exists at least one canopy that completely and with two distance thresholds,T and T2.where T1>T2 contains that cluster.Note also that while there is (These thresholds can be set by the user,or,as in our ex- some overlap,there are many points excluded by periments,selected by cross-validation.)Pick a point off each canopy.Expensive distance measurements will the list and approximately measure its distance to all other only be made between pairs of points in the same points.(This is extremely cheap with an inverted index.) canopies,far fewer than all possible pairs in the data Put all points that are within distance threshold T into a set. canopy.Remove from the list all points that are within dis- tance threshold T2.Repeat until the list is empty.Figure 1 We have found in practice that it is not difficult to create in- shows some canopies that were created by this procedure. expensive distance measures that nearly always satisfy these “canopy properties." The idea of an inverted index can also be applied to high- dimensional real-valued data.Each dimension would be dis- cretized into some number of bins,each containing a bal- 2.1 Creating Canopies anced number of data points.Then each data point is ef- In most cases,a user of the canopies technique will be able to fectively turned into a"document"containing "words"con- leverage domain-specific features in order to design a cheap sisting of the unique bin identifiers for each dimension of the distance metric and efficiently create canopies using the met- point.If one is worried about edge effects at the boundaries ric.For example,if the data consist of a large number of between bins,we can include in a data point's document the hospital patient records including diagnoses,treatments and identifiers not only of the bin in which the point is found, payment histories,a cheap measure of similarity between the but also the bins on either side.Then,as above,a cheap patients might be "1"if they have a diagnosis in common distance measure can be based on thethe number of bin and "0"if they do not.In this case canopy creation is triv- identifiers the two points have in common.A similar proce- ial:people with a common diagnosis fall in the same canopy. dure has been used previously with success [8]. (More sophisticated versions could take account of the hier- archical structure of diagnoses such as ICD9 codes,or could also include secondary diagnoses.)Note,however,that peo- 2.2 Canopies with Greedy Agglomerative ple with multiple diagnoses will fall into multiple canopies Clustering and thus the canopies will overlap. Greedy Agglomerative Clustering(GAC)is a common clus- tering technique used to group items together based on sim- Often one or a small number of features suffice to build ilarity.In standard greedy agglomerative clustering,we are canopies,even if the items being clustered(e.g.the patients) given as input a set of items and a means of computing the have thousands of features.For example,bibliographic ci- distance (or similarity)between any of the pairs of items.A C E B D Figure 1: An example of four data clusters and the canopies that cover them. Points belonging to the same cluster are colored in the same shade of gray. The canopies were created by the method outlined in section 2.1. Point A was selected at random and forms a canopy consisting of all points within the outer (solid) threshold. Points inside the inner (dashed) threshold are excluded from being the center of, and forming new canopies. Canopies for B, C, D, and E were formed similarly to A. Note that the optimality condition holds: for each cluster there exists at least one canopy that completely contains that cluster. Note also that while there is some overlap, there are many points excluded by each canopy. Expensive distance measurements will only be made between pairs of points in the same canopies, far fewer than all possible pairs in the data set. We have found in practice that it is not difficult to create inexpensive distance measures that nearly always satisfy these “canopy properties.” 2.1 Creating Canopies In most cases, a user of the canopies technique will be able to leverage domain-specific features in order to design a cheap distance metric and efficiently create canopies using the metric. For example, if the data consist of a large number of hospital patient records including diagnoses, treatments and payment histories, a cheap measure of similarity between the patients might be “1” if they have a diagnosis in common and “0” if they do not. In this case canopy creation is trivial: people with a common diagnosis fall in the same canopy. (More sophisticated versions could take account of the hierarchical structure of diagnoses such as ICD9 codes, or could also include secondary diagnoses.) Note, however, that people with multiple diagnoses will fall into multiple canopies and thus the canopies will overlap. Often one or a small number of features suffice to build canopies, even if the items being clustered (e.g. the patients) have thousands of features. For example, bibliographic citations might be clustered with a cheap similarity metric which only looks at the last names of the authors and the year of publication, even though the whole text of the reference and the article are available. At other times, especially when the individual features are noisy, one may still want to use all of the many features of an item. The following section describes a distance metric and method of creating canopies that often provides good performance in such cases. For concreteness, we consider the case in which documents are the items and words in the document are the features; the method is also broadly applicable to other problems with similar structure. 2.1.1 A Cheap Distance Metric All the very fast distance metrics for text used by search engines are based on the inverted index. An inverted index is a sparse matrix representation in which, for each word, we can directly access the list of documents containing that word. When we want to find all documents close to a given query, we need not explicitly measure the distance to all documents in the collection, but need only examine the list of documents associated with each word in the query. The great majority of the documents, which have no words in common with the query, need never be considered. Thus we can use an inverted index to efficiently calculate a distance metric that is based on the number of words two documents have in common. Given the above distance metric, one can create canopies as follows. Start with a list of the data points in any order, and with two distance thresholds, T1 and T2, where T1 > T2. (These thresholds can be set by the user, or, as in our experiments, selected by cross-validation.) Pick a point off the list and approximately measure its distance to all other points. (This is extremely cheap with an inverted index.) Put all points that are within distance threshold T1 into a canopy. Remove from the list all points that are within distance threshold T2. Repeat until the list is empty. Figure 1 shows some canopies that were created by this procedure. The idea of an inverted index can also be applied to highdimensional real-valued data. Each dimension would be discretized into some number of bins, each containing a balanced number of data points. Then each data point is effectively turned into a “document” containing “words” consisting of the unique bin identifiers for each dimension of the point. If one is worried about edge effects at the boundaries between bins, we can include in a data point’s document the identifiers not only of the bin in which the point is found, but also the bins on either side. Then, as above, a cheap distance measure can be based on the the number of bin identifiers the two points have in common. A similar procedure has been used previously with success [8]. 2.2 Canopies with Greedy Agglomerative Clustering Greedy Agglomerative Clustering (GAC) is a common clustering technique used to group items together based on similarity. In standard greedy agglomerative clustering, we are given as input a set of items and a means of computing the distance (or similarity) between any of the pairs of items