正在加载图片...
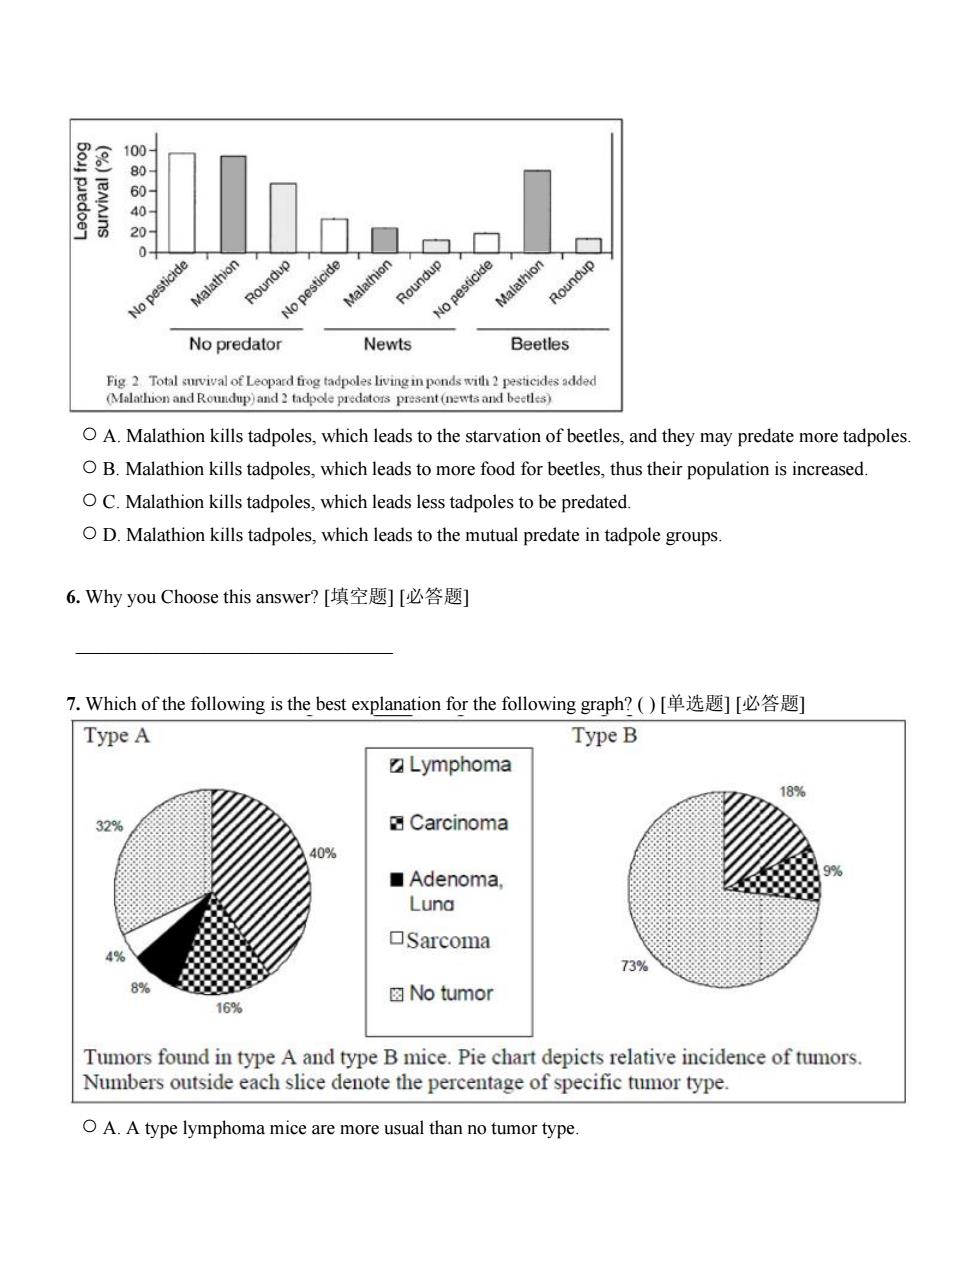
0 No pesticide Malathion Roundup de No pes Malathion Roundup No predator Newts Beetles Fig 2 Total survival of Leopard frog tadpoles livingin ponds with 2 pesticides added (Malathion and Roundup)and 2 tadpole predators present(newts and beetles) O A.Malathion kills tadpoles,which leads to the starvation of beetles,and they may predate more tadpoles. O B.Malathion kills tadpoles,which leads to more food for beetles,thus their population is increased. O C.Malathion kills tadpoles,which leads less tadpoles to be predated O D.Malathion kills tadpoles,which leads to the mutual predate in tadpole groups. 6.Why you Choose this answer?[填空题][必答题] 7.Which of the following is the best explanation for the following graph?()[单选题][必答题] Type A Type B ☑Lymphoma 18% 32% Carcinoma 40% ■Adenoma, Luna ▣Sarcoma 4% 73% 8% ☒No tumor 16% Tumors found in type A and type B mice.Pie chart depicts relative incidence of tumors. Numbers outside each slice denote the percentage of specific tumor type. O A.A type lymphoma mice are more usual than no tumor type.○ A. Malathion kills tadpoles, which leads to the starvation of beetles, and they may predate more tadpoles. ○ B. Malathion kills tadpoles, which leads to more food for beetles, thus their population is increased. ○ C. Malathion kills tadpoles, which leads less tadpoles to be predated. ○ D. Malathion kills tadpoles, which leads to the mutual predate in tadpole groups. 6. Why you Choose this answer? [填空题] [必答题] _________________________________ 7. Which of the following is the best explanation for the following graph? ( ) [单选题] [必答题] ○ A. A type lymphoma mice are more usual than no tumor type