正在加载图片...
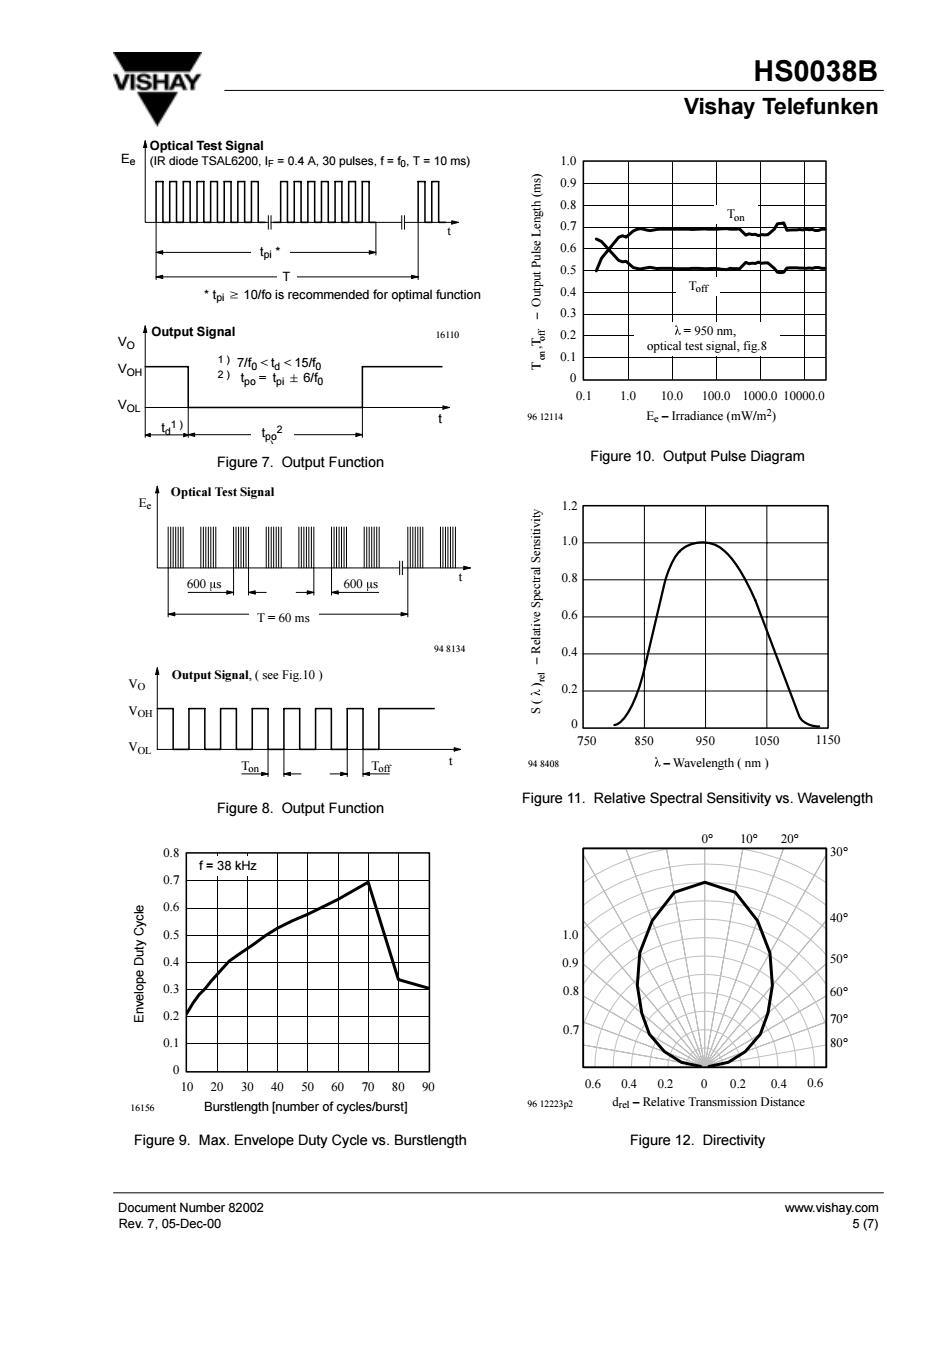
VISHAY HS0038B Vishay Telefunken mmMM to* 0. to 2 10/fo is recommended for optimal function Vo ↑Output Signal 16110 7%脱 6 Figure7.Output Function Figure 10.Output Pulse Diagram E.0 ptical Test ignal LL业 600s60世 -T-60m5 4313到 0 *mmm 850 959 05 -Wavelength nm Figure 8.Output Function Figure 11.Relative Spectral Sensitivity vs.Wavelength 010e f=38k灯 0.7 06 05 04 03 02 0 0.1 10203040506070809% 16156 Burstlength [number of cycles/burst] Figure 9.Max.Envelope Duty Cycle vs.Burstlength Figure 12.Directivity Rer70e0eb62o2HS0038B Vishay Telefunken Rev. 7, 05-Dec-00 5 (7) Document Number 82002 www.vishay.com Ee T tpi * t * tpi 10/fo is recommended for optimal function VO VOH VOL t 16110 Optical Test Signal (IR diode TSAL6200, IF = 0.4 A, 30 pulses, f = f0, T = 10 ms) Output Signal td 1 ) tpo 2 ) 1 ) 7/f0 < td < 15/f0 2 ) tpo = tpi 6/f0 Figure 7. Output Function Ee t VO VOH VOL t 600 s 600 s T = 60 ms Ton Toff 94 8134 Optical Test Signal Output Signal, ( see Fig.10 ) Figure 8. Output Function 0 0.1 0.2 0.3 0.4 0.5 0.6 0.7 0.8 10 20 30 40 50 60 70 80 90 16156 Burstlength [number of cycles/burst] Envelope Duty Cycle f = 38 kHz Figure 9. Max. Envelope Duty Cycle vs. Burstlength 0 0.1 0.2 0.3 0.4 0.5 0.6 0.7 0.8 0.9 1.0 0.1 1.0 10.0 100.0 1000.0 10000.0 Ee – Irradiance (mW/m2 96 12114 ) on off T ,T – Output Pulse Length (ms) Ton = 950 nm, optical test signal, fig.8 Toff Figure 10. Output Pulse Diagram 750 850 950 1050 0 0.2 0.4 0.6 0.8 1.2 S ( ) – Relative Spectral Sensitivity rel – Wavelength ( nm ) 1150 94 8408 1.0 Figure 11. Relative Spectral Sensitivity vs. Wavelength 96 12223p2 0.6 0.4 0.2 0 0.2 0.4 0.6 0.9 0° 30° 10° 20° 40° 50° 60° 70° 80° 1.0 0.8 0.7 drel – Relative Transmission Distance Figure 12. Directivity���