正在加载图片...

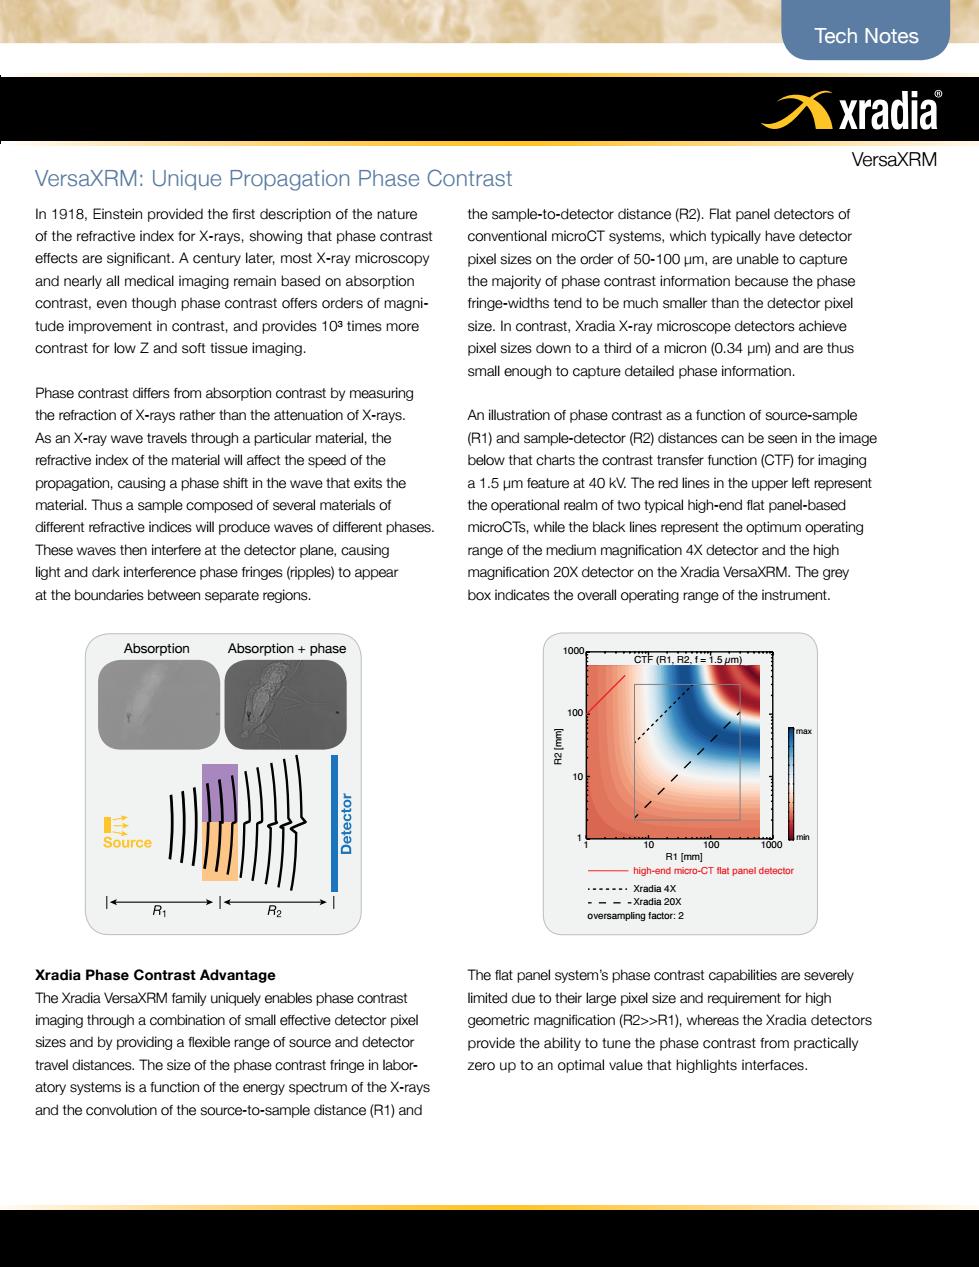
Tech Notes 入xradia VersaXRM VersaXRM:Unique Propagation Phase Contrast In 1918,Einstein provided the first description of the nature the sample-to-detector distance(R2).Flat panel detectors of of the refractive index for X-rays,showing that phase contrast conventional microCT systems,which typically have detector effects are significant.A century later,most X-ray microscopy pixel sizes on the order of 50-100 um,are unable to capture and nearly all medical imaging remain based on absorption the majority of phase contrast information because the phase contrast,even though phase contrast offers orders of magni- fringe-widths tend to be much smaller than the detector pixel tude improvement in contrast,and provides 103 times more size.In contrast,Xradia X-ray microscope detectors achieve contrast for low Z and soft tissue imaging. pixel sizes down to a third of a micron(0.34 um)and are thus small enough to capture detailed phase information. Phase contrast differs from absorption contrast by measuring the refraction of X-rays rather than the attenuation of X-rays. An illustration of phase contrast as a function of source-sample As an X-ray wave travels through a particular material,the (R1)and sample-detector(R2)distances can be seen in the image refractive index of the material will affect the speed of the below that charts the contrast transfer function(CTF)for imaging propagation,causing a phase shift in the wave that exits the a 1.5 um feature at 40 kV.The red lines in the upper left represent material.Thus a sample composed of several materials of the operational realm of two typical high-end flat panel-based different refractive indices will produce waves of different phases. microCTs,while the black lines represent the optimum operating These waves then interfere at the detector plane,causing range of the medium magnification 4X detector and the high light and dark interference phase fringes(ripples)to appear magnification 20X detector on the Xradia VersaXRM.The grey at the boundaries between separate regions. box indicates the overall operating range of the instrument. Absorption Absorption phase 1000 CTFB1,2,f=1.5m) 100 10 Source 10 100 1000 R1 [mm] -high-end micro-CT flat panel detector .-----Xradia 4X ----X灯adia20X R1 R2 oversampling factor:2 Xradia Phase Contrast Advantage The flat panel system's phase contrast capabilities are severely The Xradia VersaXRM family uniquely enables phase contrast limited due to their large pixel size and requirement for high imaging through a combination of small effective detector pixel geometric magnification(R2>>R1),whereas the Xradia detectors sizes and by providing a flexible range of source and detector provide the ability to tune the phase contrast from practically travel distances.The size of the phase contrast fringe in labor- zero up to an optimal value that highlights interfaces. atory systems is a function of the energy spectrum of the X-rays and the convolution of the source-to-sample distance(R1)andTech Notes Understanding the Technical Advantage of Xradia Contrast VersaXRM In 1918, Einstein provided the first description of the nature of the refractive index for X-rays, showing that phase contrast effects are significant. A century later, most X-ray microscopy and nearly all medical imaging remain based on absorption contrast, even though phase contrast offers orders of magnitude improvement in contrast, and provides 10³ times more contrast for low Z and soft tissue imaging. Phase contrast differs from absorption contrast by measuring the refraction of X-rays rather than the attenuation of X-rays. As an X-ray wave travels through a particular material, the refractive index of the material will affect the speed of the propagation, causing a phase shift in the wave that exits the material. Thus a sample composed of several materials of different refractive indices will produce waves of different phases. These waves then interfere at the detector plane, causing light and dark interference phase fringes (ripples) to appear at the boundaries between separate regions. Xradia Phase Contrast Advantage The Xradia VersaXRM family uniquely enables phase contrast imaging through a combination of small effective detector pixel sizes and by providing a flexible range of source and detector travel distances. The size of the phase contrast fringe in laboratory systems is a function of the energy spectrum of the X-rays and the convolution of the source-to-sample distance (R1) and the sample-to-detector distance (R2). Flat panel detectors of conventional microCT systems, which typically have detector pixel sizes on the order of 50-100 μm, are unable to capture the majority of phase contrast information because the phase fringe-widths tend to be much smaller than the detector pixel size. In contrast, Xradia X-ray microscope detectors achieve pixel sizes down to a third of a micron (0.34 μm) and are thus small enough to capture detailed phase information. An illustration of phase contrast as a function of source-sample (R1) and sample-detector (R2) distances can be seen in the image below that charts the contrast transfer function (CTF) for imaging a 1.5 μm feature at 40 kV. The red lines in the upper left represent the operational realm of two typical high-end flat panel-based microCTs, while the black lines represent the optimum operating range of the medium magnification 4X detector and the high magnification 20X detector on the Xradia VersaXRM. The grey box indicates the overall operating range of the instrument. The flat panel system’s phase contrast capabilities are severely limited due to their large pixel size and requirement for high geometric magnification (R2>>R1), whereas the Xradia detectors provide the ability to tune the phase contrast from practically zero up to an optimal value that highlights interfaces. VersaXRM: Unique Propagation Phase Contrast 1 10 100 1000 R1 [mm] 1 10 100 1000 R2 [mm] max min high-end micro-CT flat panel detector Xradia 20X Xradia 4X oversampling factor: 2 CTF (R1, R2, f = 1.5 µm) Absorption Absorption + phase