正在加载图片...
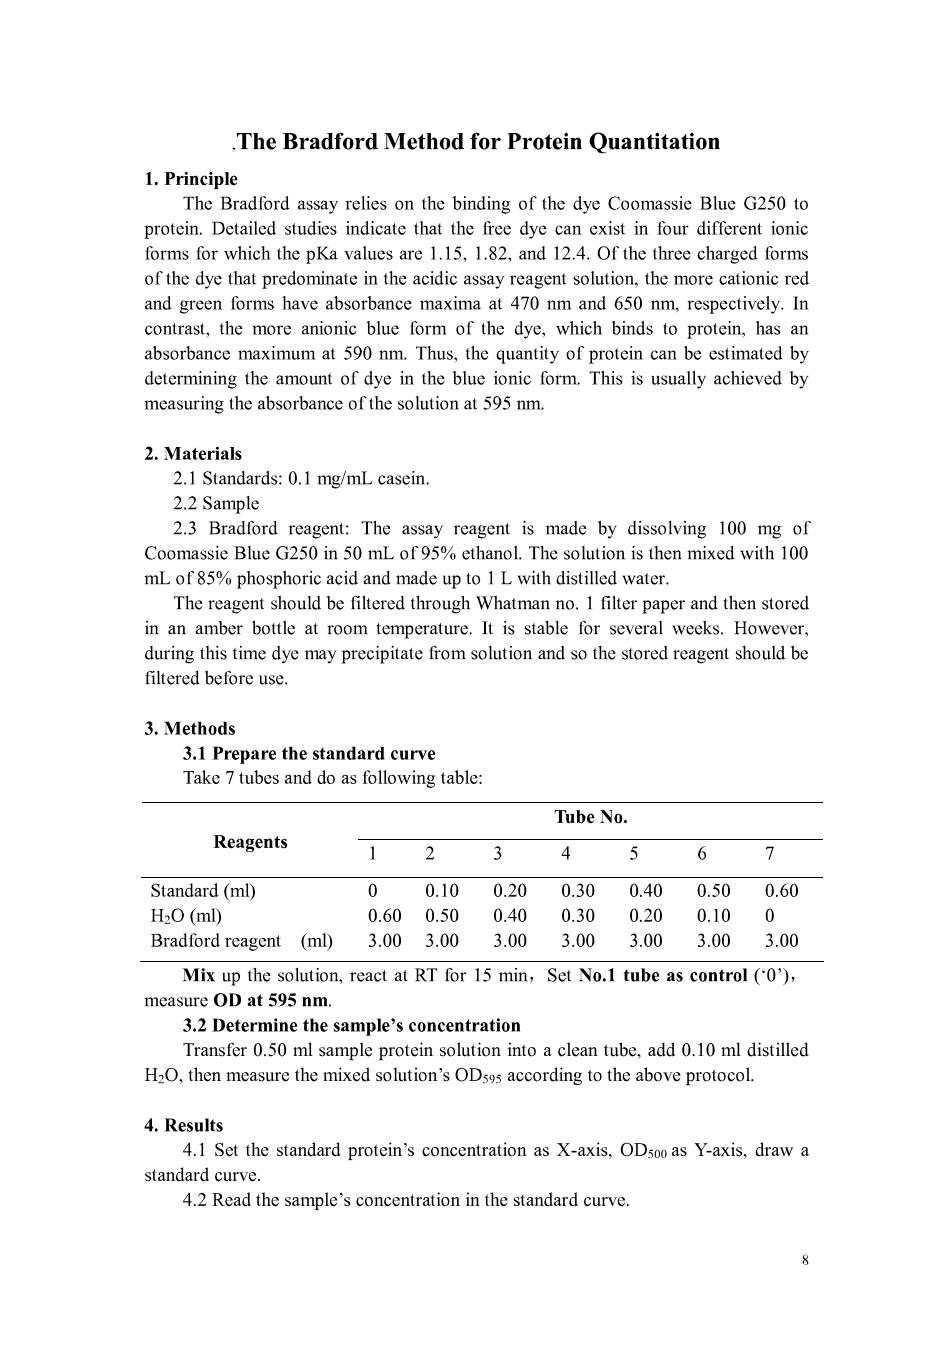
.The Bradford Method for Protein Quantitation 1.Principle The Bradford assay relies on the binding of the dye Coomassie Blue G250 to protein.Detailed studies indicate that the free dye can exist in four different ionic forms for which the pKa values are 1.15,1.82,and 12.4.Of the three charged forms of the dye that predominate in the acidic assay reagent solution,the more and green forms have absorbance maxima at 470nm and 650nm respectively.I contrast,the more anionic blue form of the dye,which binds to protein.has an absorbance maximum at 590 nm.Thus,the quantity of protein can be estimated by determining the amount of dye in the blue ionic form.This is usually achieved by measuring the absorbance of the solution at 595 nm. 2.Materials 2.1 Standards:0.I mg/mL casein. 2.2 Sample 2.3 Bradford reagent:The assay reagent is made by dissolving 100 mg of anol The solution is then mixed with 100 mLof85%phosphorieacidandmadeupto1Lwithdistilcdwalcr The reagent should be filtered through Whatman no.1 filter paper and then stored in an amber bottle at room temperature.It is stable for several weeks.However, during this time dye may precipitate from solution and so the stored reagent should be filtered before use 3.Methods 3.1 Prepare the standard curve Take 7 tubes and do as following table: Tube No. Reagents 1 2 3 5 6 7 Standard(ml) 0 0.100.200.300.400.500.60 H-O (ml) 060050 040 030020 0.100 Bradford reagent (ml) 3.003.00 3.00 3.00300 3.00300 Mix up the solution,react at RT for 15 min,Set No.1 tube as control () measure ODat 595nm 3.2 Determine the sample's concentration Transfer 0.50 ml sample protein solution into a clean tube,add 0.10 ml distilled H2O,then measure the mixed solution's ODs9s according to the above protocol. 4.Results 4.1 Set the standard protein's concentration as X-axis,ODsoo as Y-axis,draw a standard curve. 4.2 Read the sample's concentration in the standard curve