正在加载图片...
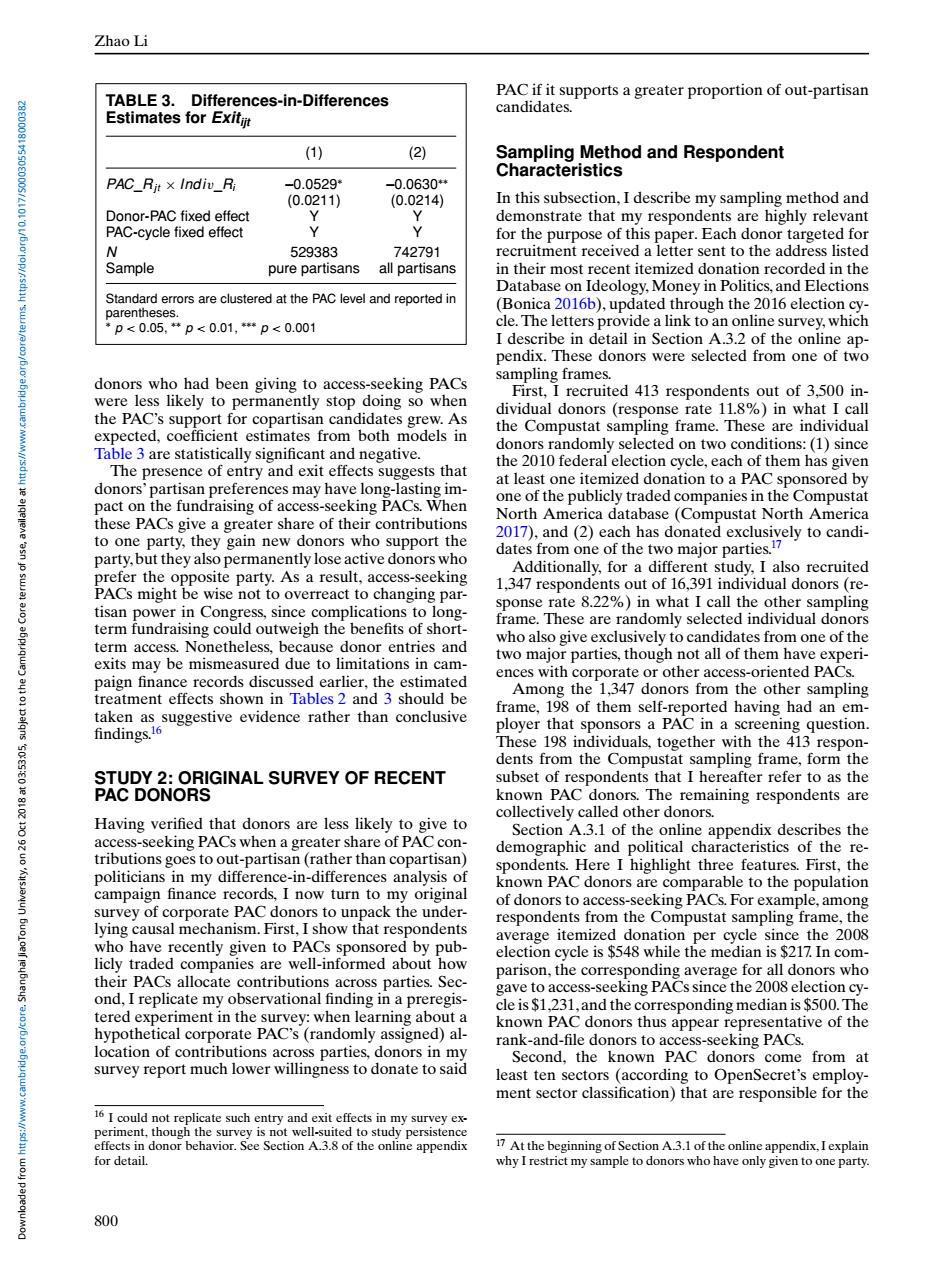
Zhao Li TABLE 3. Differences-in-Differences PAC if it supports a greater proportion of out-partisan Estimates for Exitijt candidates. (1) (2) Sampling Method and Respondent Characteristics PAC_Rit×Indiv_.R -0.0529 -0.0630* (0.0211) (0.0214) In this subsection,I describe my sampling method and Donor-PAC fixed effect Y Y demonstrate that my respondents are highly relevant PAC-cycle fixed effect Y Y for the purpose of this paper.Each donor targeted for N 529383 742791 recruitment received a letter sent to the address listed Sample pure partisans all partisans in their most recent itemized donation recorded in the Database on Ideology,Money in Politics,and Elections Standard errors are clustered at the PAC level and reported in parentheses. (Bonica 2016b),updated through the 2016 election cy- P<0.05,* p<0.01,**p<0.001 cle.The letters provide a link to an online survey,which I describe in detail in Section A.3.2 of the online ap- pendix.These donors were selected from one of two sampling frames. donors who had been giving to access-seeking PACs were less likely to permanently stop doing so when First,I recruited 413 respondents out of 3,500 in- the PAC's support for copartisan candidates grew.As dividual donors (response rate 11.8%)in what I call expected,coefficient estimates from both models in the Compustat sampling frame.These are individual Table 3 are statistically significant and negative. donors randomly selected on two conditions:(1)since The presence of entry and exit effects suggests that the 2010 federal election cycle,each of them has given at least one itemized donation to a PAC sponsored by donors'partisan preferences may have long-lasting im- 4号元 pact on the fundraising of access-seeking PACs.When one of the publicly traded companies in the Compustat North America database (Compustat North America these PACs give a greater share of their contributions 2017),and (2)each has donated exclusively to candi- to one party,they gain new donors who support the party,but they also permanently lose active donors who dates from one of the two major parties.7 & Additionally.for a different study.I also recruited prefer the opposite party.As a result,access-seeking PACs might be wise not to overreact to changing par- 1,347 respondents out of 16,391 individual donors(re- sponse rate 8.22%)in what I call the other sampling tisan power in Congress,since complications to long term fundraising could outweigh the benefits of short- frame.These are randomly selected individual donors who also give exclusively to candidates from one of the term access.Nonetheless,because donor entries and two major parties,though not all of them have experi- exits may be mismeasured due to limitations in cam- paign finance records discussed earlier,the estimated ences with corporate or other access-oriented PACs. treatment effects shown in Tables 2 and 3 should be Among the 1,347 donors from the other sampling frame,198 of them self-reported having had an em- taken as suggestive evidence rather than conclusive findings.16 ployer that sponsors a PAC in a screening question. These 198 individuals,together with the 413 respon- P135501c90 dents from the Compustat sampling frame,form the STUDY 2:ORIGINAL SURVEY OF RECENT subset of respondents that I hereafter refer to as the PAC DONORS known PAC donors.The remaining respondents are collectively called other donors. Having verified that donors are less likely to give to Section A.3.1 of the online appendix describes the access-seeking PACs when a greater share of PAC con- demographic and political characteristics of the re- tributions goes to out-partisan(rather than copartisan) spondents.Here I highlight three features.First,the politicians in my difference-in-differences analysis of known PAC donors are comparable to the population campaign finance records,I now turn to my original of donors to access-seeking PACs.For example,among survey of corporate PAC donors to unpack the under- respondents from the Compustat sampling frame,the lying causal mechanism.First,I show that respondents average itemized donation per cycle since the 2008 who have recently given to PACs sponsored by pub- election cycle is $548 while the median is $217 In com- licly traded companies are well-informed about how parison,the corresponding average for all donors who eys their PACs allocate contributions across parties.Sec- gave to access-seeking PACs since the 2008 election cy- ond,I replicate my observational finding in a preregis- cle is $1,231,and the corresponding median is $500.The tered experiment in the survey:when learning about a known PAC donors thus appear representative of the hypothetical corporate PAC's(randomly assigned)al- rank-and-file donors to access-seeking PACs. location of contributions across parties,donors in my Second,the known PAC donors come from at survey report much lower willingness to donate to said least ten sectors (according to OpenSecret's employ- ment sector classification)that are responsible for the 16 I could not replicate such entry and exit effects in my survey ex. periment,though the survey is not well-suited to study persistence effects in donor behavior.See Section A.3.8 of the online appendix 17 At the beginning of Section A.3.1 of the online appendix.Iexplain for detail. why I restrict my sample to donors who have only given to one party. 800Zhao Li TABLE 3. Differences-in-Differences Estimates for Exitijt (1) (2) PAC_Rjt × Indiv_Ri –0.0529∗ –0.0630∗∗ (0.0211) (0.0214) Donor-PAC fixed effect Y Y PAC-cycle fixed effect Y Y N 529383 742791 Sample pure partisans all partisans Standard errors are clustered at the PAC level and reported in parentheses. ∗ p < 0.05, ∗∗ p < 0.01, ∗∗∗ p < 0.001 donors who had been giving to access-seeking PACs were less likely to permanently stop doing so when the PAC’s support for copartisan candidates grew. As expected, coefficient estimates from both models in Table 3 are statistically significant and negative. The presence of entry and exit effects suggests that donors’ partisan preferences may have long-lasting impact on the fundraising of access-seeking PACs. When these PACs give a greater share of their contributions to one party, they gain new donors who support the party, but they also permanently lose active donors who prefer the opposite party. As a result, access-seeking PACs might be wise not to overreact to changing partisan power in Congress, since complications to longterm fundraising could outweigh the benefits of shortterm access. Nonetheless, because donor entries and exits may be mismeasured due to limitations in campaign finance records discussed earlier, the estimated treatment effects shown in Tables 2 and 3 should be taken as suggestive evidence rather than conclusive findings.16 STUDY 2: ORIGINAL SURVEY OF RECENT PAC DONORS Having verified that donors are less likely to give to access-seeking PACs when a greater share of PAC contributions goes to out-partisan (rather than copartisan) politicians in my difference-in-differences analysis of campaign finance records, I now turn to my original survey of corporate PAC donors to unpack the underlying causal mechanism. First, I show that respondents who have recently given to PACs sponsored by publicly traded companies are well-informed about how their PACs allocate contributions across parties. Second, I replicate my observational finding in a preregistered experiment in the survey: when learning about a hypothetical corporate PAC’s (randomly assigned) allocation of contributions across parties, donors in my survey report much lower willingness to donate to said 16 I could not replicate such entry and exit effects in my survey experiment, though the survey is not well-suited to study persistence effects in donor behavior. See Section A.3.8 of the online appendix for detail. PAC if it supports a greater proportion of out-partisan candidates. Sampling Method and Respondent Characteristics In this subsection, I describe my sampling method and demonstrate that my respondents are highly relevant for the purpose of this paper. Each donor targeted for recruitment received a letter sent to the address listed in their most recent itemized donation recorded in the Database on Ideology,Money in Politics, and Elections (Bonica 2016b), updated through the 2016 election cycle. The letters provide a link to an online survey, which I describe in detail in Section A.3.2 of the online appendix. These donors were selected from one of two sampling frames. First, I recruited 413 respondents out of 3,500 individual donors (response rate 11.8%) in what I call the Compustat sampling frame. These are individual donors randomly selected on two conditions: (1) since the 2010 federal election cycle, each of them has given at least one itemized donation to a PAC sponsored by one of the publicly traded companies in the Compustat North America database (Compustat North America 2017), and (2) each has donated exclusively to candidates from one of the two major parties.17 Additionally, for a different study, I also recruited 1,347 respondents out of 16,391 individual donors (response rate 8.22%) in what I call the other sampling frame. These are randomly selected individual donors who also give exclusively to candidates from one of the two major parties, though not all of them have experiences with corporate or other access-oriented PACs. Among the 1,347 donors from the other sampling frame, 198 of them self-reported having had an employer that sponsors a PAC in a screening question. These 198 individuals, together with the 413 respondents from the Compustat sampling frame, form the subset of respondents that I hereafter refer to as the known PAC donors. The remaining respondents are collectively called other donors. Section A.3.1 of the online appendix describes the demographic and political characteristics of the respondents. Here I highlight three features. First, the known PAC donors are comparable to the population of donors to access-seeking PACs. For example, among respondents from the Compustat sampling frame, the average itemized donation per cycle since the 2008 election cycle is $548 while the median is $217. In comparison, the corresponding average for all donors who gave to access-seeking PACs since the 2008 election cycle is $1,231, and the corresponding median is $500.The known PAC donors thus appear representative of the rank-and-file donors to access-seeking PACs. Second, the known PAC donors come from at least ten sectors (according to OpenSecret’s employment sector classification) that are responsible for the 17 At the beginning of Section A.3.1 of the online appendix, I explain why I restrict my sample to donors who have only given to one party. 800 Downloaded from https://www.cambridge.org/core. Shanghai JiaoTong University, on 26 Oct 2018 at 03:53:05, subject to the Cambridge Core terms of use, available at https://www.cambridge.org/core/terms. https://doi.org/10.1017/S0003055418000382